
Assessing the Total Cost of ETF Ownership
The total cost of owning an ETF may vary widely on a fund-by-fund and investor-by-investor basis.
/s3.amazonaws.com/arc-authors/morningstar/a90ba90e-1da2-48a4-98bf-a476620dbff0.jpg)
A version of this article was published in the February 2017 issue of Morningstar ETFInvestor. Download a complimentary copy of ETFInvestor here.
Exchange-traded funds have become the investment wrapper of choice for a growing number of investors ranging from institutions to individuals. Transparency, tradability, tax efficiency, and low costs are the trademarks of the ETF package. Fees in particular are a critical input in investors' ETF selection process. But when it comes to choosing an ETF--particularly when picking among funds tracking identical or substantially similar benchmarks--it's important to look beyond the headline fee and take a more holistic approach to assessing the total cost of ETF ownership. Here I will outline the components of the total cost of owning an ETF, address how to size them, and discuss how their relative importance varies depending on an investor's circumstances.
The Math The total cost of ETF ownership can be roughly split into two parts: holding costs and transaction costs.
Total Cost of Ownership = Holding Costs + Transaction Costs
The relative importance of the two will vary depending chiefly on an investor's time horizon and the amount of money he is looking to invest. Holding costs include fees and a variety of other factors that affect ETFs' benchmark-relative, or tracking performance. Transaction costs include commissions, bid-ask spreads, and market impact.
In general, holding costs will represent the largest component of the total cost of ownership for long-term investors in an ETF, as they are by definition incurred throughout the holding period. Transaction costs will matter more to investors who have shorter time horizons, particularly in cases where they are looking to invest large sums of money.
Holding Costs Fees are typically the largest component of the cost of holding an ETF. They are also the most readily available and stable piece of a fund's all-in holding costs. But there are implicit costs to account for, too. These costs stem from a variety of factors.
Sampling
The manner in which funds seek to replicate their benchmarks can also be a substantial source of implicit holding costs. For instance, a fund tracking a benchmark that contains a number of smaller, less-liquid components like an emerging-markets or fixed-income fund may use "sampling" techniques to replicate the returns of its index. Sampling involves investing in a select basket of only the largest, most-liquid components of the benchmark index in an effort to improve the overall liquidity of the fund itself (it makes the creation and redemption process simpler and cheaper for market makers) and to minimize costs. While sampling has some obvious advantages, by virtue of excluding some smaller, less-liquid components of a fund's reference index, it creates another potential source of tracking difference as the fund strays from perfectly mirroring its benchmark. A useful case study that demonstrates the potential for sampling to create tracking issues is
Index Turnover Index turnover costs reflect another potential source of tracking problems. While index investing is an inherently passive strategy, the fact of the matter is that indexes do experience turnover. Bankruptcies and mergers and acquisitions are some of the more common causes of a change in an index's composition. The costs involved in realigning the portfolio to reflect these changes may ultimately show up in funds' benchmark-relative performance.
Dividends
The timing and tax treatment of dividend payments are also potential sources of tracking troubles for ETFs. The period between funds' ex-dividend dates and dividend payment dates can potentially affect funds' tracking performance, depending on how the portfolio manager handles the cash that is bound for shareholders. In many cases, portfolio managers may equitize this cash by investing in futures to maintain market exposure and ensure tight tracking. Some funds, most notably
Dividend taxation is another important consideration. For example, when international equity funds receive dividends from securities located in multiple tax jurisdictions outside their domicile, the associated foreign dividend withholding taxes can create an additional drag on performance. These withholding taxes cannot always be fully reclaimed, and when they are clawed back it may be at the expense of time and effort. There may also be instances where the tax treatment embedded in an index's calculation may differ from the tax reality of the fund. This can have a positive or negative impact on funds' tracking performance.
Securities Lending Securities lending can be a source of revenue for funds that can offset, to varying degrees, funds' holding costs. The degree to which this activity adds to funds' performance depends on a variety of factors. For example, small-cap funds typically generate greater lending-related revenue given that there is more demand from short sellers to borrow small-cap stocks than large-cap stocks. Investors can find information on funds' securities-lending programs in fund prospectuses. Revenue generated from these programs is reported in the income statements in funds' annual reports.
Sizing Them Up These costs manifest themselves in a gap between the performance of an index-tracking ETF and its benchmark. There are a number of different ways to measure this rift.
The first is tracking difference. All else equal, ETFs and index funds would be expected to produce returns that lag their benchmark by an amount equal to their expense ratio. For example, assume an investor owns an ETF that tracks the S&P 500. The fund charges a hypothetical expense ratio of 0.25%. In a given year the S&P 500 rises 10%. The investor's return, net of fees, would be 9.75%:
Tracking Difference = ETF Return - Benchmark Index Return
Expense ratios are the most predictable and readily quantifiable source of the tracking difference between ETFs and their reference indexes.
Tracking error is another measure commonly used to gauge ETFs' tracking performance. It's important to distinguish between tracking difference and tracking error: Tracking difference is simply the difference between an ETF's return and that of its benchmark during a given period. Tracking error measures the standard deviation of the difference between an ETF's return and its benchmark's return over time.
In 2012, Morningstar introduced a novel approach to measuring ETFs' holding costs. Specifically, we decomposed tracking error into two separate data points: estimated holding cost and tracking volatility. Our estimated holding cost captures the predictable drift from the total return version of the index owed to both explicit and hidden costs and revenue, such as swap contract spreads, dividend withholding taxes, and securities lending. Our tracking volatility calculation isolates the risky, unpredictable deviations of performance from the index, which are typically caused by sampling or otherwise incomplete replication of the benchmark's portfolio. Splitting the traditional tracking error measure into its constituent parts can provide a more accurate assessment of an average investor's true holding costs.
Trading Costs Holding costs are forever. Trading costs are paid as investors come and go. The most explicit cost of trading ETFs is a brokerage commission. In most cases, this commission is now less than $10 per trade. Of course, many ETFs now trade on a commission-free basis. So depending on the ETF and the brokerage in question, this may or may not be an input into an investor's total cost math.
The next most meaningful component of trading costs is the bid-ask spread, or the difference between the price at which a market maker is willing to buy an ETF's shares (the bid) and the price at which they are willing to sell them (the ask). Buyers and sellers pay this spread. The market maker collects it as compensation for matching the two sides. In the case of most large and liquid ETFs, this spread tends to be a penny or two wide. That said, spreads will vary on a fund-by-fund basis (they'll be wider for municipal-bond ETFs than large-cap stock ETFs) and in response to market environments (greater volatility will lead to wider spreads).
The final piece of transaction costs to consider is market impact. This is the degree to which your trade might move the market against you. Larger trades, especially in the case of less-liquid funds, are more likely to have greater market impact. A big trade in an ETF has the potential to move a fund's share price. For example, a big buyer might push up the price paid, thus creating an implicit transaction cost.
Pulling It All Together Here, using our proprietary total cost data points, I've restated the simplified total cost math I presented earlier.
Total Cost = Holding Component + Market Impact Component + Commission
Holding Component = IA1 X HP2 X ((EHC3 + TV4 / √ (250) X 1.96) / 100
Market Impact Component = 2 X IA X √ (IA / 100,000) X (MIC5 / 100)
(1) Investment Amount; (2) Holding Period, in Years; (3) Estimated Holding Cost; (4) Tracking Volatility; (5) Market Impact Cost
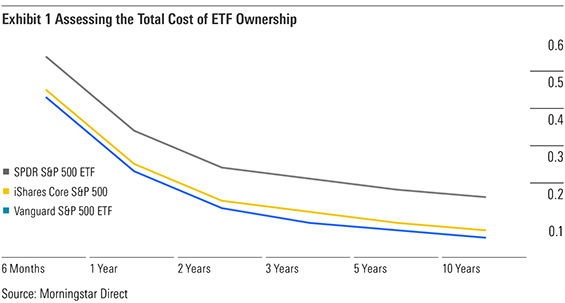
All this math may be enough to leave you cross-eyed, so I've brought it to life in Exhibit 1. What you see is a side-by-side comparison of the total cost of ownership of the three S&P 500-tracking ETFs: SPY,

Disclosure: Morningstar, Inc. licenses indexes to financial institutions as the tracking indexes for investable products, such as exchange-traded funds, sponsored by the financial institution. The license fee for such use is paid by the sponsoring financial institution based mainly on the total assets of the investable product. Please click here for a list of investable products that track or have tracked a Morningstar index. Neither Morningstar, Inc. nor its investment management division markets, sells, or makes any representations regarding the advisability of investing in any investable product that tracks a Morningstar index.
/d10o6nnig0wrdw.cloudfront.net/04-18-2024/t_34ccafe52c7c46979f1073e515ef92d4_name_file_960x540_1600_v4_.jpg)
/d10o6nnig0wrdw.cloudfront.net/04-09-2024/t_e87d9a06e6904d6f97765a0784117913_name_file_960x540_1600_v4_.jpg)
/cloudfront-us-east-1.images.arcpublishing.com/morningstar/T2LGZCEHBZBJJPPKHO7Y4EEKSM.png)
:quality(80)/s3.amazonaws.com/arc-authors/morningstar/a90ba90e-1da2-48a4-98bf-a476620dbff0.jpg)