
The Hidden Risk of Low-Volatility Investing
Low-volatility strategies tend to be more sensitive to fluctuating interest rates than the broad market.
/s3.amazonaws.com/arc-authors/morningstar/56fe790f-bc99-4dfe-ac84-e187d7f817af.jpg)
A version of this article was published in the January 2017 issue of Morningstar ETFInvestor. Download a complimentary copy of ETFInvestor here.
Interest rates have a powerful impact on security prices. As rates rise, the expected rate of return for all securities must increase to compete for investors' money. This adjustment can be painful because it often requires prices to fall. Fixed-rate bonds are the most obvious example. Because their cash flows are fixed, the entire return adjustment must come from falling prices. Stocks are also affected by interest rates, but the impact is more difficult to anticipate because, unlike bonds, stocks do not have a finite life or fixed cash flows. However, their interest-rate sensitivity should be positively related to the stability of their cash flows. Consequently, low-volatility stocks should be highly sensitive to changing interest rates, as the remainder of this article will demonstrate.
Interest rates do not change in a vacuum. They tend to increase as the economy strengthens and central banks become concerned about inflation. Conversely, rates tend to fall when times are tough and demand weakens. Corporate profitability also fluctuates with the business cycle. Firms that are more sensitive to the business cycle tend to experience greater cash flow growth during economic expansions. As a result, they should do better when rates rise than their less-cyclical counterparts. But their cash flow also tends to contract more during economic downturns, when rates are most likely to fall, offsetting the benefit from lower rates. This suggests that stocks with more-stable cash flows should be more sensitive to interest rates.
Consistent with this theory, I published an article a few years ago showing that high-dividend-yielding stocks, stocks in more-defensive industries, and large-cap stocks tended to be more sensitive to changes in interest rates than their lower-yielding, more cyclical, and smaller counterparts. To test the idea more directly, I extended this analysis to a few low-volatility indexes, including the S&P 500 Low Volatility and MSCI USA Minimum Volatility indexes. These indexes underlie PowerShares S&P 500 Low Volatility ETF SPLV and
The two indexes take very different approaches to mitigate volatility. The S&P index simply targets the least-volatile 100 members of the S&P 500 during the past 12 months and weights its holdings by the inverse of their volatility, so that the least-volatile stock receives the largest weighting. There are no constraints on its sector weightings, which often cause it to skew heavily toward interest-rate-sensitive utilities.
In contrast, MSCI uses a more complex optimization approach that considers both individual stock volatility and interactions among stocks to construct the least-volatile portfolio possible, under a set of constraints. Most notably, it limits its sector tilts relative to the broad large-cap market. These adjustments should make this index slightly less sensitive to interest rates than the S&P index because they tend to give it less exposure to defensive sectors.
Interest-Rate-Sensitivity Analysis To assess how these indexes performed in different interest-rate environments, I ranked the monthly changes in the 10-year U.S. Treasury yield from high to low from December 1990 through November 2016. The 25% of months with the largest positive interest-rate changes represented periods of rising rates. The bottom 25% represented the falling rate environment, while the middle 50% represented the constant rate environment. I then tracked each index's annualized returns in the months corresponding to each of those three environments. Exhibit 1 shows the results.
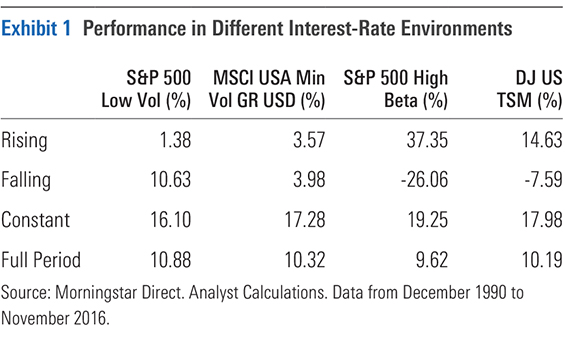
As expected, both low-volatility indexes tended to underperform the market, represented by the Dow Jones U.S. Total Stock Market Index, when rates were rising and to outperform when they fell. The magnitude of this under- and outperformance in the two environments was greater for the S&P 500 Low Volatility Index, likely because of its greater exposure to defensive sectors.
If low-volatility stocks tend to underperform when rates rise and outperform when they fall because they have smaller changes in cash flow to offset these changes in interest rates, high-volatility stocks should follow the opposite pattern. To test this, I included the S&P 500 High Beta Index (which PowerShares S&P 500 High Beta ETF SPHB tracks) in this analysis. This index targets the 100 stocks in the S&P 500 with the greatest sensitivity to market fluctuations (highest betas) during the past year. It then weights them in proportion to their market sensitivity so that the most-sensitive stocks receive the largest weightings. Consistent with expectations, this highly volatile index tended to outperform the market when rates rose and lag when they fell, as shown in Exhibit 1.
I supplemented this test with a more robust regression analysis that sought to explain these indexes' returns (over Treasuries) using the market risk premium and monthly changes in the 10-year Treasury yield as explanatory variables. This approach controls for fluctuations in the market to present a clearer picture of how changing interest rates affect performance. Exhibit 2 shows the coefficients from these regressions. These indicate how sensitive each index is to the market and changing interest rates and the direction of those relationships. For example, an interest-rate coefficient of negative 1.1 would indicate that a 1% increase in monthly interest-rate changes corresponds to a 1.1% decrease in the index's return.
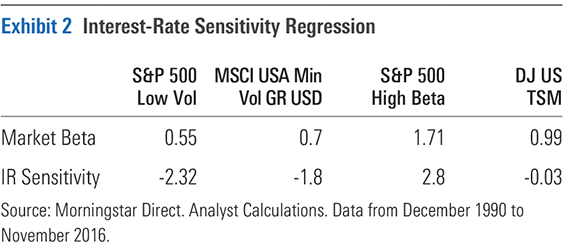
The regression results corroborate the findings above. Both low-volatility indexes have a significant inverse relationship with interest-rate changes, while the high-beta index has a positive relationship with this variable. These interest-rate coefficients become a little smaller (in absolute terms) after adding small size, value, and momentum as additional variables in the regression, but they are still significant.
As a robustness check, I replicated this analysis for the euro-denominated version of the MSCI Europe Minimum Volatility Index, using the euro-area 10-year government benchmark bond yield collected by the European Central Bank in place of the 10-year U.S. Treasury yield. Like its U.S. counterpart, this index had a significant inverse relationship with interest-rate changes. However, this effect was slightly weaker in the eurozone (the interest-rate coefficient was negative 1.13).
Low-Volatility Strategies for a Rising Rate Environment Mindful of the impact that fluctuating interest rates can have on low-volatility stocks, S&P developed the S&P 500 Low Volatility Rate Response Index, which PowerShares S&P 500 ex-Rate Sensitive Low Volatility ETF XRLV tracks. To determine each stock's interest-rate sensitivity, S&P runs a regression of stock returns against changes in the 10-year Treasury rate during the past five years. It then ranks all stocks in the S&P 500 by their interest-rate sensitivity and excludes the 100 with the smallest positive (or largest negative) interest-rate sensitivity from the eligible universe. This adjustment modestly reduces the index's style purity. Of the remaining stocks, the 100 with the lowest volatility during the past 12 months qualify for inclusion in the portfolio, and they are weighted by the inverse of their volatility.
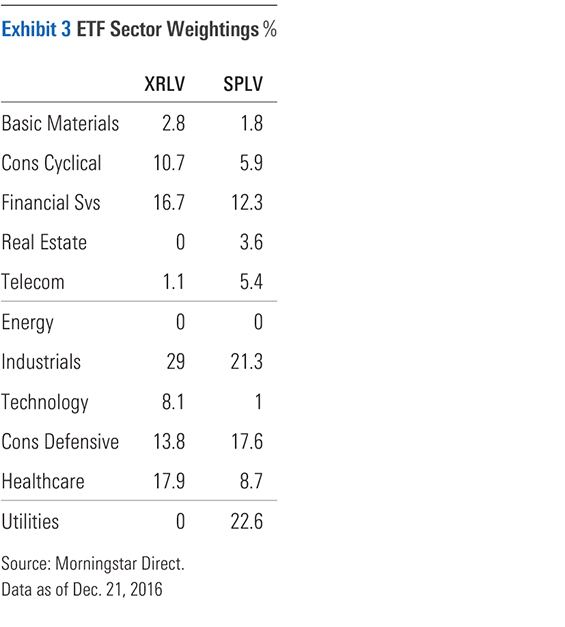
While more than 60% of this index's portfolio overlaps with the standard S&P 500 Low Volatility Index, as of this writing, some of their sector weightings are very different, as Exhibit 3 illustrates. Utilities are the most notable example. The interest-rate-sensitivity screen currently blocks all utilities stocks from XRLV's portfolio, while they make up 23% of SPLV's.
Despite the S&P Low Volatility Rate Response Index's attempt to limit its interest-rate sensitivity, a two-factor regression analysis revealed that it still exhibited significant negative exposure to interest-rate changes. However, it was less sensitive to interest-rate changes than the standard S&P 500 Low Volatility Index (the interest-rate coefficients for the two indexes were negative 1.59 and negative 2.32, respectively). The S&P 500 Low Volatility Rate Response Index isn't a silver bullet. It was slightly more volatile than its interest-rate-agnostic counterpart. And its five-year look-back period may not be long enough to accurately reflect a stock's sensitivity to interest rates in different environments. But it should do better in a rising rate environment than SPLV.
Small-cap stocks should also do better in a rising rate environment because they tend to be more sensitive to the business cycle. Therefore, a small-cap low-volatility strategy like
While rising interest rates could create a headwind for low-volatility strategies, many of them are still good long-term investments. These strategies have tended to hold up better than the market during downturns and, despite their interest-rate sensitivity, bounce around less than the market. These attractive characteristics should persist, potentially setting up better risk-adjusted performance than the market. For that reason, I'm continuing to hold my investments in USMV and XSLV.

Disclosure: Morningstar, Inc. licenses indexes to financial institutions as the tracking indexes for investable products, such as exchange-traded funds, sponsored by the financial institution. The license fee for such use is paid by the sponsoring financial institution based mainly on the total assets of the investable product. Please click here for a list of investable products that track or have tracked a Morningstar index. Neither Morningstar, Inc. nor its investment management division markets, sells, or makes any representations regarding the advisability of investing in any investable product that tracks a Morningstar index.
/d10o6nnig0wrdw.cloudfront.net/04-18-2024/t_34ccafe52c7c46979f1073e515ef92d4_name_file_960x540_1600_v4_.jpg)
/d10o6nnig0wrdw.cloudfront.net/04-09-2024/t_e87d9a06e6904d6f97765a0784117913_name_file_960x540_1600_v4_.jpg)
/cloudfront-us-east-1.images.arcpublishing.com/morningstar/T2LGZCEHBZBJJPPKHO7Y4EEKSM.png)
:quality(80)/s3.amazonaws.com/arc-authors/morningstar/56fe790f-bc99-4dfe-ac84-e187d7f817af.jpg)