
The Battle of Costs Versus Performance
Are you better off with a high-cost fund with great past returns, or a low-cost fund with poor past returns?
/s3.amazonaws.com/arc-authors/morningstar/fcc1768d-a037-447d-8b7d-b44a20e0fcf2.jpg)
This article was published in the October 2016 issue of Morningstar FundInvestor. Download a complimentary copy of FundInvestor by visiting the website.
“Who cares what a fund charges? If a fund has great returns, then I know it was able to overcome its fee.”
I see comments like this one just about every time I write about the predictive power of fees. There’s a certain logic to it, but the problem is one of persistence. Fund expense ratios don’t tend to change much, whereas performance changes a lot.
I’ve shown how fees predict success, but this time I wanted to go one step further and look at the combination of expenses and past performance. Would you rather own a low-cost fund with poor past performance, or a high-cost fund with great past performance? Novice investors would typically say the latter, but the former is the better choice.
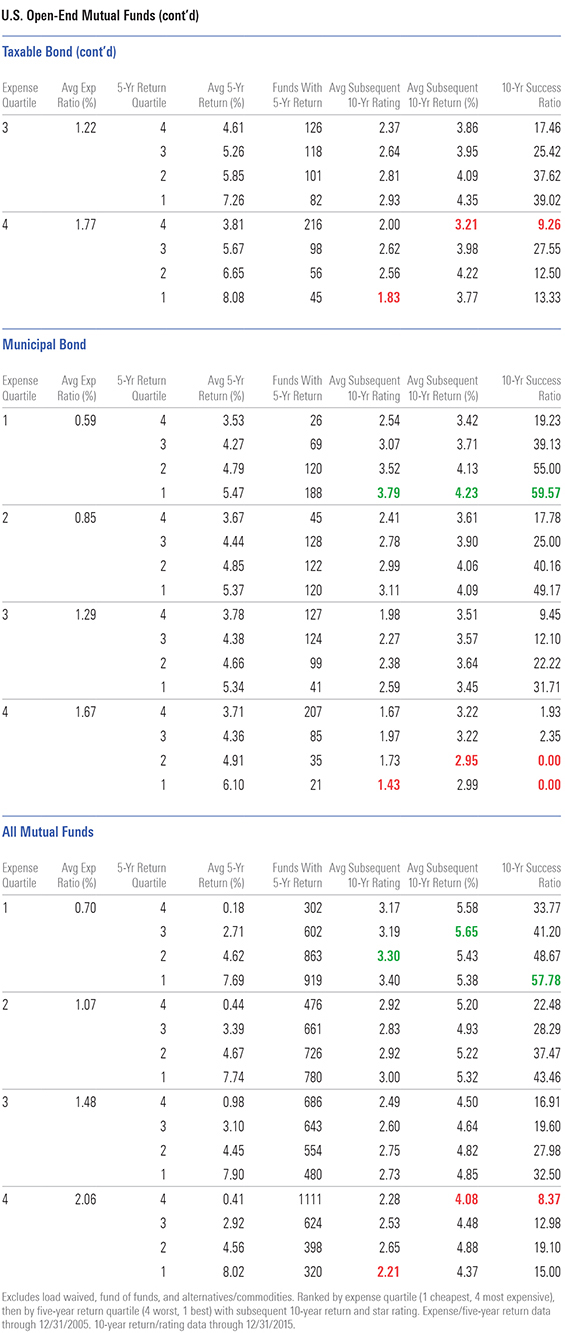
I went back 10 years and grouped funds into expense ratio quartiles relative to Morningstar Category and trailing five-year return quartile by category. (I used the past five years because that’s the time period investors seem to rely on most.) Then I combined the data so that fee quartiles were grouped by past returns. That left me with 16 groups of funds: the cheapest funds divided into quartiles by return, the second-cheapest funds in return quartiles, and so on (see tables below).
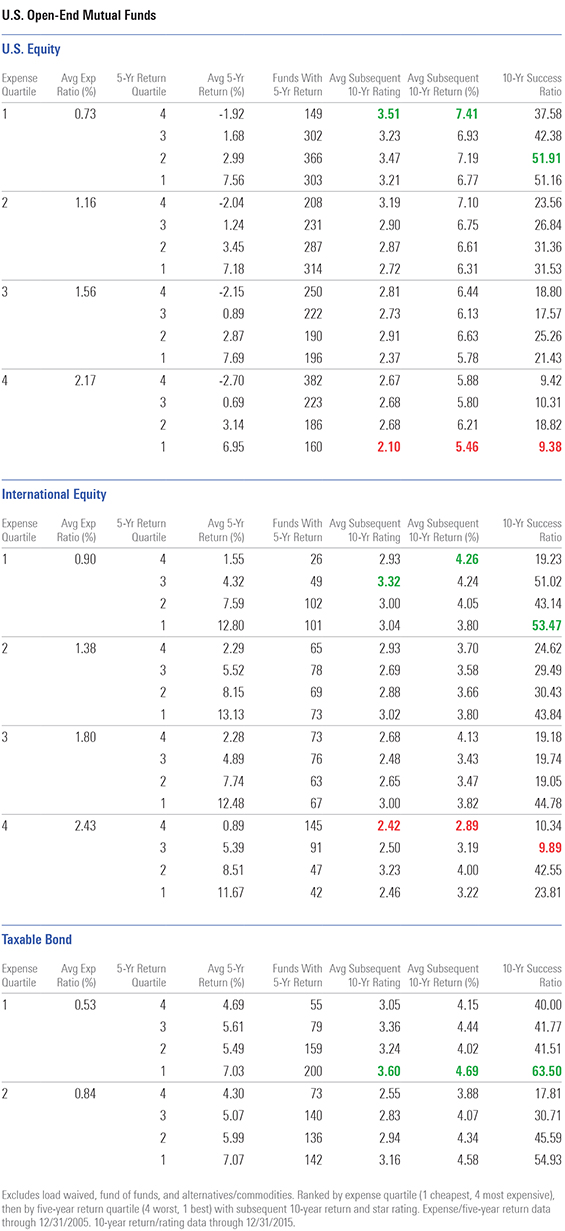
At the end of 2005, the U.S. equity funds in the cheapest quartile, but with returns in the worst quartile, had an expense ratio of 0.73% and an average five-year return of negative 1.92% annualized. The funds in the priciest quartile but with top-quartile performance had an expense ratio averaging 2.17%, but returns were a robust annualized 6.95%. So, how did the next 10 years go? The funds that started with low costs and poor returns went on to enjoy a 7.41% annualized return, compared with 5.46% for those formerly high-performing pricey funds. In fact, the cheap laggards produced the highest returns of any of the 16 groups, while the pricey sports cars had the worst of any group.
The return figures actually understate the difference because high-cost failures were more likely to be liquidated by the parent company because of subsequent periods of poor performance. This is why I use success ratios in conjunction with returns. What happened? Low costs delivered the goods and high costs hurt performance. We read too much into past performance, but the data shows we should pay more attention to expense ratios. Expenses are a constant whose impact compounds over time. Jack Bogle calls it the “relentless rules of humble arithmetic.” In addition, a smaller part was played by the way that markets rotate favor so that lagging sectors and strategies recover while strong sectors and strategies revert to the mean. Thus, those funds with lagging five-year returns often came back to beat the funds that won the previous round.
I’d also call your attention to the success ratio. That figure tells you what percentage of a group of funds survived and outperformed over the next period in question. Here we see a 38% success ratio for the cheap laggards versus just 9% for the pricey funds. This tells me that the cheap funds not only outperformed but also were much more likely to survive than the pricey return champions. Only 9% of those seemingly appealing pricey funds delivered a good result to shareholders.
Moving out from U.S. equities, performance became less of a contrary indicator, but it was still better to bet on low fees than big returns.
For international equity, the cheapest-quartile funds with the worst past returns also had the best returns going forward. In this case, they earned an annualized 4.26%, versus 3.22% for the priciest funds with the best past returns. Once again, the cheap laggards had the best results of any of the 16 groups, though the priciest funds with great past returns at least managed to finish third from the bottom.
Among taxable-bond funds, the story was a little different. Yes, the cheap laggards went on to beat the pricey return champions, but the returns part of the screen didn’t seem to matter. Cheap funds did well across the board, and pricey ones did poorly. The best-performing group was the cheapest funds with top-quartile performance, and the worst was the priciest funds with bottom-quartile performance. So, we didn’t see a snapback reversion to the mean so much as the steady hand of low costs.
For muni-bond funds, cheap funds ruled the day once more, though again it didn’t help much to sort by returns. The real drama, though, was in the success ratios. The priciest muni funds had success ratios of a mere 2% for pricey funds with poor past performance and 0% for pricey funds with good performance.
Looking at the success ratios across the board, they have an interesting story to tell. While the top future returns generally came from low-cost laggards, the top success ratios generally came from low-cost funds that outperformed over the prior five years. The main reason would be that a fund with low costs and strong past performance is highly unlikely to be killed off and also quite likely to be a big fund, as fees are inversely related to asset size. And naturally, big funds are good bets to survive.
Take-Aways Needless to say, expense ratios are the place to start for mutual funds. You can see how a fund's fees stack up by checking the fee level listed next to the expense ratios near the top of the fund quote page. A Low fee level means a fund is in the cheapest 20% of its distribution group. Look for funds with strong managers, good strategies, good stewardship, and good performance over the manager's entire tenure, too. You want to understand past performance, but don't read too much into recent returns.
/cloudfront-us-east-1.images.arcpublishing.com/morningstar/ZKOY2ZAHLJVJJMCLXHIVFME56M.jpg)
/cloudfront-us-east-1.images.arcpublishing.com/morningstar/IGTBIPRO7NEEVJCDNBPNUYEKEY.png)
/cloudfront-us-east-1.images.arcpublishing.com/morningstar/HDPMMDGUA5CUHI254MRUHYEFWU.png)
:quality(80)/s3.amazonaws.com/arc-authors/morningstar/fcc1768d-a037-447d-8b7d-b44a20e0fcf2.jpg)