
Defensive Equity Under the Microscope
Low-volatility strategies won't always keep pace with the market, but they can still be compelling.
/s3.amazonaws.com/arc-authors/morningstar/56fe790f-bc99-4dfe-ac84-e187d7f817af.jpg)
A version of this article was published in the July 2015 issue of Morningstar ETFInvestor. Download a complimentary copy of ETFInvestor here.
Since May 2011, asset managers have launched more than 20 low-volatility funds, which attempt to reduce volatility relative to a traditional equity portfolio. There are other ways to accomplish that goal, such as substituting bonds for stocks. But there is a good chance that low-volatility equity strategies will offer higher returns than a stock/bond portfolio with comparable volatility, albeit with smaller diversification benefits. Some have argued that these strategies may even offer comparable returns to a broad stock portfolio over the long run, as they have in the recent past. However, even if low-volatility strategies don't pull off this feat, they can still be compelling.
There should be a positive relationship between nondiversifiable risk and return. But the market doesn't evenly compensate all risk. Historically, stocks with low volatility or sensitivity to market fluctuations (betas) have offered better returns per unit of risk (as defined by those metrics) than their more volatile counterparts. This effect was first uncovered in 1972 by Fischer Black, Michael Jensen, and Myron Scholes. Other researchers have since found supporting evidence. From 1968 to 2013, the least volatile fifth of the U.S. market actually offered higher returns than the most volatile fifth.
Yet, low-volatility strategies have recently come under fire. Dimensional Fund Advisors published a paper in August 2014 in which it argued that low-beta stocks' marketlike returns from 1970 through 2013 could be attributed to the strategy's bias toward value stocks. But it pointed out that low-volatility strategies have inconsistent exposure to value stocks. If these strategies have lower exposure to value stocks going forward, they may not be able to keep pace with the market. For instance, from 1928 through 1969, Dimensional found that a broadly diversified portfolio of low-beta stocks exhibited a growth bias, and during that time it lagged the portfolio of high-beta stocks, which had a value tilt. Dimensional argues that it would be more efficient to target value stocks directly.
Robert Novy-Marx, a professor at the University of Rochester and consultant to Dimensional, also launched an attack on low-volatility investing in his paper, "Understanding Defensive Equity." He pointed out that there hasn't been much separation in returns among the stocks in the four quintiles with the lowest volatility from 1968 through 2013. But during that time the most volatile quintile significantly underperformed. These tended to be small-cap stocks with poor profitability and high valuations, characteristics that are associated with low returns, independent of volatility. He found that defensive stocks only generated higher returns than aggressive stocks in the small-growth segment. More broadly, he argued that the low-volatility strategy's tilt toward stocks with high profitability and low valuations could explain its attractive performance, and that it would be more efficient to target stocks with those characteristics directly.
The implication of these critiques is that low-volatility strategies need to overweight stocks with low valuations and/or high profitability in order to keep pace with the market. Otherwise, they should generate lower returns over the long term. Because these strategies do not explicitly target stocks with these characteristics, there is no guarantee that they will be able to generate marketlike returns in the future. This suggests that investors would be better off reducing their exposure to equities (allocating a greater portion to bonds) to reduce volatility and explicitly targeting stocks with low valuations or high profitability to boost returns.
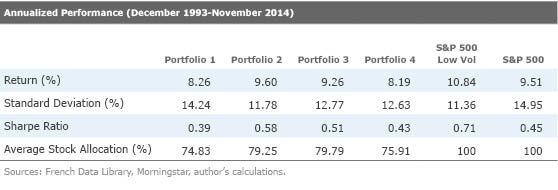
Empirical Findings To test this theory, I constructed four stock/bond portfolios and compared their performance against the S&P 500 Low Volatility Index. This index tracks the least volatile 100 members of the S&P 500 and weights its holdings by the inverse of their volatilities, so that the least volatile constituents receive the largest weightings in the portfolio.
The bond portion of each portfolio is represented by the Barclays Aggregate Bond Index. The equity portions consist of the 30% of U.S. stocks with the lowest valuations (Portfolio 1), 30% with the highest profitability (Portfolio 2), a 50/50 investment in the stocks held in portfolios 1 and 2 (Portfolio 3), and the broad market (Portfolio 4). Each year in the simulation, I assigned the stock/bond weightings based on the levels that would have equated the portfolio's volatility with the volatility of the S&P 500 Low Volatility Index over the previous three years, constraining their weightings between 0% and 100% (which does not allow shorting or the use of leverage). I tracked the performance of the resulting portfolios during the next year, updated the weightings at the end of each year, and repeated the process. The simulations cover the period from December 1993 through November 2014.
The table below shows the results of these simulations. Although the portfolios' volatility matched that of the S&P 500 Low Volatility Index over the three-year period before they were formed, the low-volatility index still had the lowest realized volatility. This was despite the other portfolios' 20%-25% average bond allocation throughout the period. It also generated the highest return of all the portfolios in the group--even higher than that of the S&P 500. Consequently, it offered the highest ratio of return in excess of Treasuries to volatility (Sharpe ratio). The profitability portfolio (2) came close to matching the index's volatility profile and offered the second-highest Sharpe ratio. Portfolios 1 and 4, which included value stocks and the broad market, respectively, fell short on both counts.
A regression analysis reveals that the S&P 500 Low Volatility Index's returns during the simulation period could, in fact, be attributed to tilts toward stocks with low valuations and high profitability. But in practice, it still would have offered a better outcome than explicitly targeting stocks with those characteristics and combining them with bonds to mitigate volatility during the sample period.
Low-volatility strategies may not consistently offer marketlike returns, but they can still be good investment options. In their critique of low-volatility strategies, Robert Novy-Marx and Dimensional ignored the benefits of reducing volatility itself. Volatility is not a perfect measure of risk. But it is worth heeding because it is directionally related to the probability of large losses. Stocks with low volatility tend to hold up better during market downturns than those with high volatility. Therefore, it isn't appropriate to gauge low-volatility strategies' success on returns alone. It is better to compare their Sharpe ratios and other risk-adjusted return measures against the market's. From 1931 through 1965, when low-beta (volatility) stocks posted lower returns than their higher-beta (more-volatile) counterparts, they still offered more attractive returns relative to their volatility, based on Black, Jensen, and Scholes' seminal paper in 1972.
An Alternative Explanation Borrowing constraints may help explain low-volatility stocks' attractive historical risk/reward profile. Low-volatility stocks tend to lag during bull markets and may offer slightly lower expected returns than the market over the long run. Therefore, these stocks may not be appealing to investors who are trying to beat a benchmark, especially because many investors are unwilling or unable to borrow to boost these stocks' returns (a prudent course for most). That may push the prices of low-volatility stocks down, allowing them to offer more-attractive returns relative to their risk. This is the argument that Andrea Frazzini and Lasse Pedersen, two principals at AQR, make in their paper, "Betting Against Beta." Consistent with this theory, the authors found that mutual funds and individual investors, which typically face borrowing constraints, have tended to overweight riskier stocks on average.
Frazzini and Pedersen argue that less-constrained investors, such as private equity funds, should prefer the more favorable risk/reward trade-off that less-volatile investments offer and apply leverage to boost returns. That is, in fact, the pattern they find. Because many investors face borrowing constraints, there is a good chance that low-volatility stocks will continue to offer better risk-adjusted returns than a broad stock market index. However, it may not be reasonable to expect them to offer higher absolute returns.
If low-volatility stocks continue to generate more-favorable risk/reward trade-offs than their more volatile counterparts, investors could borrow to lever up their position in these stocks to boost their returns and achieve comparable volatility to the market. However, it is important to bear in mind that borrowing introduces additional risks. Investors can take advantage of this effect without borrowing by allocating a larger portion of their portfolios to low-volatility stocks in place of bonds.
Investment Options
In contrast,
Investors can apply this same strategy in foreign developed and emerging markets through
References 1) Jensen, M., Black, F., and Scholes, M. 1972. "The Capital Asset Pricing Model: Some Empirical Tests." http://papers.ssrn.com/sol3/papers.cfm?abstract_id=908569
2) Crill, W. 2014. "Low Volatility Strategies." Dimensional Fund Advisors White Paper.
3) Novy-Marx, R. 2014. "Understanding Defensive Equity." NBER Working Paper No. 20591. http://www.nber.org/papers/w20591
4) Frazzini, A., and Pedersen, L.H. 2014. "Betting Against Beta." Swiss Finance Institute Research Paper No. 12–17. http://papers.ssrn.com/sol3/papers.cfm?abstract_id=2049939
Disclosure: Morningstar, Inc.'s Investment Management division licenses indexes to financial institutions as the tracking indexes for investable products, such as exchange-traded funds, sponsored by the financial institution. The license fee for such use is paid by the sponsoring financial institution based mainly on the total assets of the investable product. Please click here for a list of investable products that track or have tracked a Morningstar index. Neither Morningstar, Inc. nor its investment management division markets, sells, or makes any representations regarding the advisability of investing in any investable product that tracks a Morningstar index.
/cloudfront-us-east-1.images.arcpublishing.com/morningstar/T2LGZCEHBZBJJPPKHO7Y4EEKSM.png)
/d10o6nnig0wrdw.cloudfront.net/04-18-2024/t_34ccafe52c7c46979f1073e515ef92d4_name_file_960x540_1600_v4_.jpg)
/d10o6nnig0wrdw.cloudfront.net/04-09-2024/t_e87d9a06e6904d6f97765a0784117913_name_file_960x540_1600_v4_.jpg)
:quality(80)/s3.amazonaws.com/arc-authors/morningstar/56fe790f-bc99-4dfe-ac84-e187d7f817af.jpg)