15 Charts Explaining an Extreme Year for Investors
We look back at a brutal year in stocks, bonds, and crypto.

If your portfolio took a beating in 2022, you’re not alone. There were few places for investors to hide as nearly every corner of the financial markets posted big losses.
In addition to stocks spending most of the year in a bear market, many parts of the bond market posted their biggest losses in history, meaning fixed income failed to live up to its traditional role of providing a cushion to ride out the decline in equities. In the background, decades-high inflation remained much hotter than expected, interest rates surged, and fears of a looming recession were key contributors to a painful year that most investors would rather forget.
Only a very narrow section of the stock market—truly defensive names such as stable, high-dividend payers—offered shelter from the storm.
The fourth quarter brought some relief, but not enough to have changed the outcome: 2022 was a year for the record books—and usually not in a good way.
Here’s our full review:
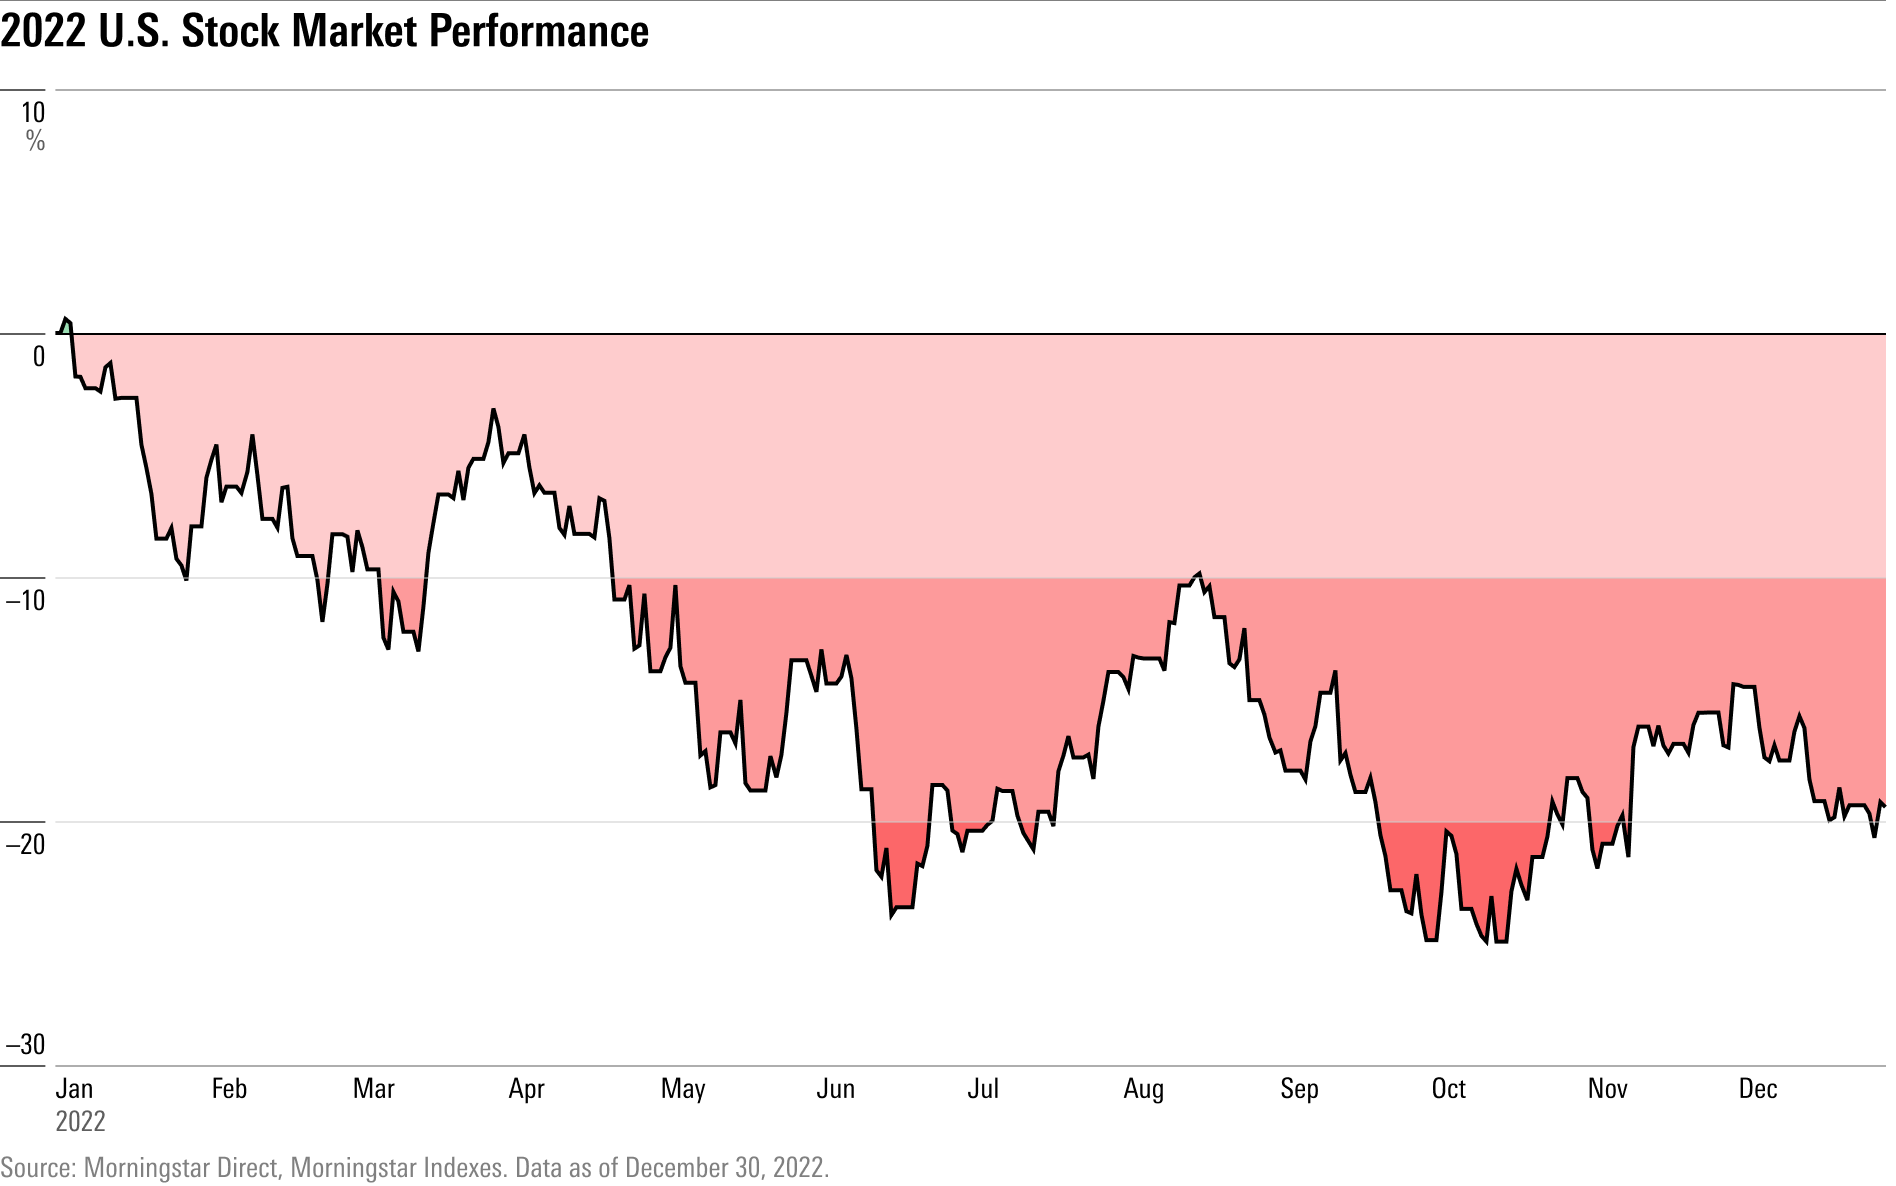
Key Stats: 2022 Market Performance
- The Morningstar US Market Index ended the year down 19.4%, its biggest annual loss since 2008.
- U.S. stock market losses were moderated by a gain of 7.3% during the last three months of the year, snapping the index’s losing streak from the year’s first three quarters. The U.S. Market Index reached its lowest point of the bear market on Oct. 14, when it was down 24.9% from the start of the year.
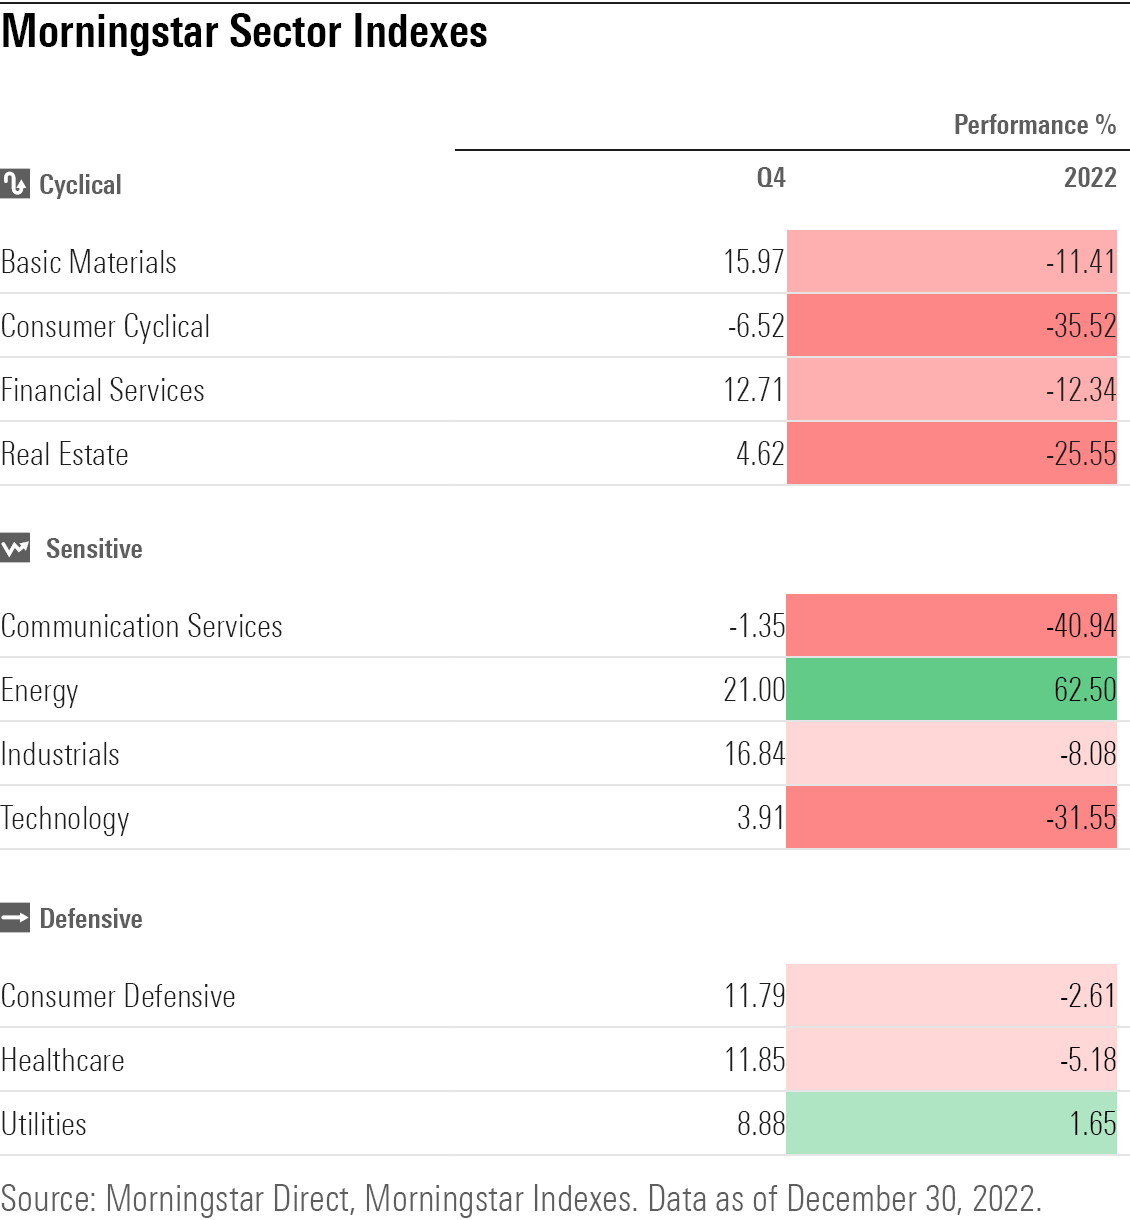
- On a sector level, big technology stocks plummeted while energy soared. The Morningstar US Energy Index gained 62.5% for its best year in the 24-year history of the index. The Morningstar US Communication Services Index—containing tech giants such as Facebook’s parent company Meta Platforms META and Google’s parent company Alphabet GOOGL—fell 40.9%, its worst loss since the start of performance history in 1998.
- Growth stocks were crushed, with the Morningstar US Growth Index falling 36.7%, but value stocks broadly avoided significant losses.
- Bonds had their worst year in modern history as the Morningstar US Core Bond Index fell 12.9%. Prior calendar-year losses for the index had never exceeded 2%.
- The fourth quarter brought some much-needed relief for fixed income, as the index rose 1.9%.
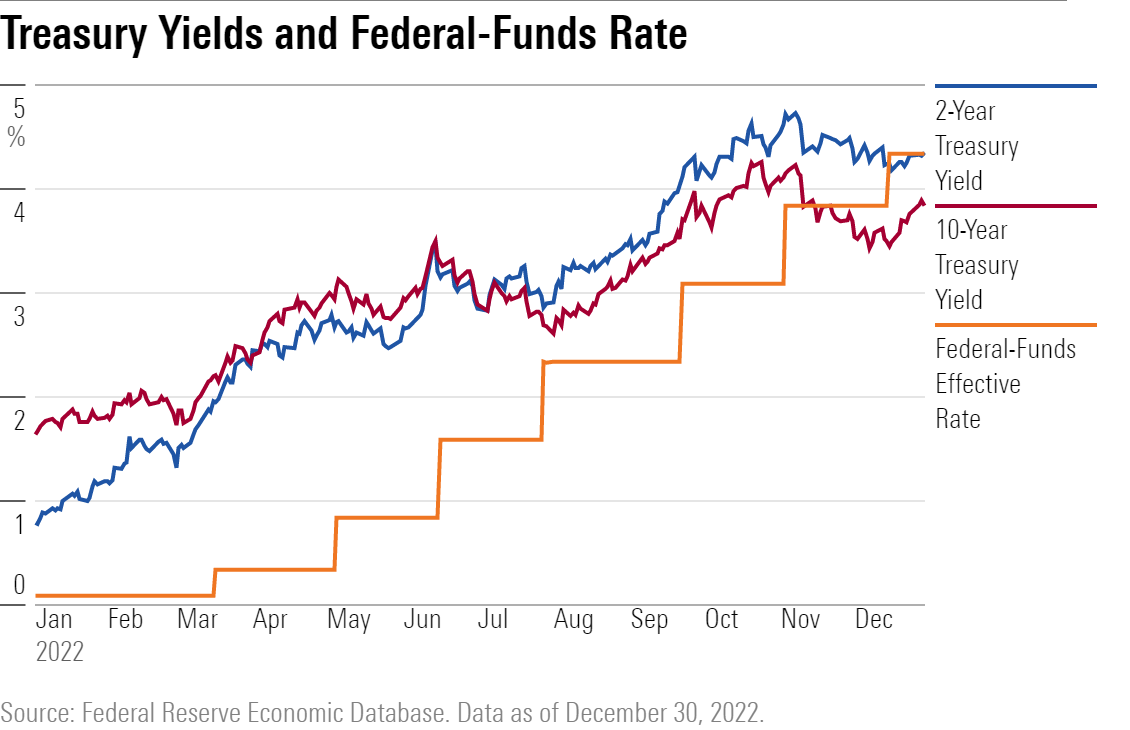
- The Federal Reserve raised its benchmark federal-funds rate at its fastest pace in history, with seven interest-rate hikes through the course of the year, bringing the effective rate to a range of 4.25%-4.50%, up from zero in January.
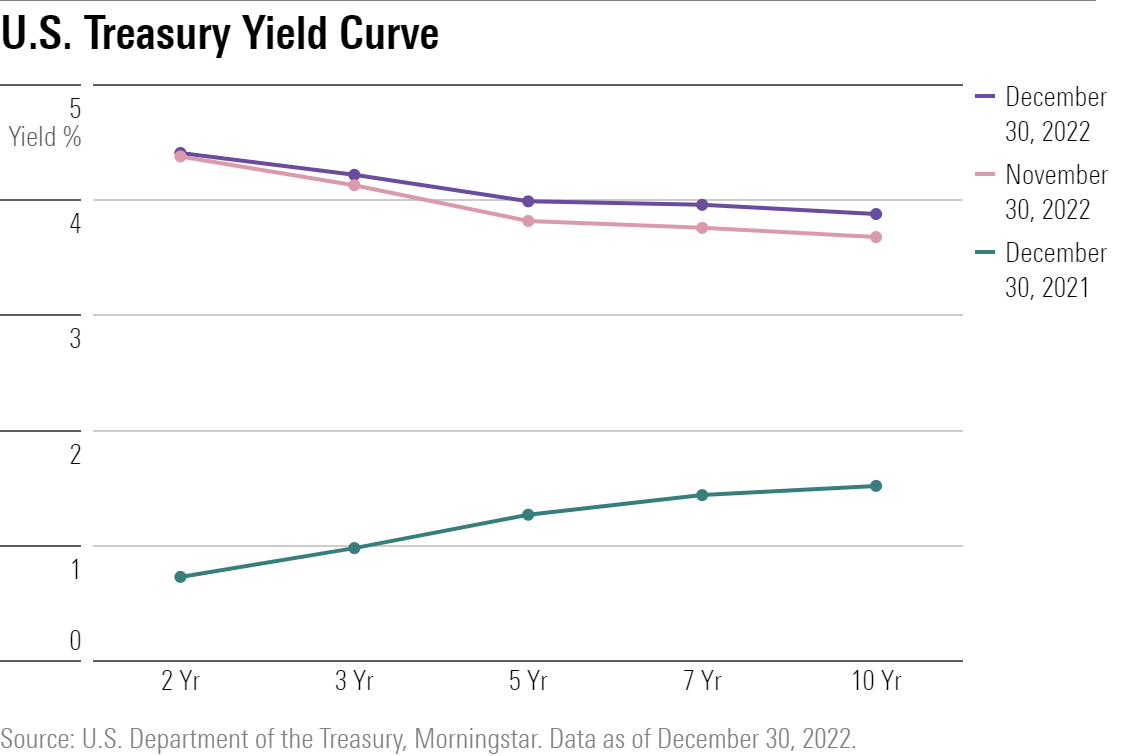
- Treasury yields of all maturities surged in 2022, especially short-term yields, which are most directly affected by the Fed’s moves. The two-year Treasury yield rose to 4.3%, up from 0.8% in January. Ten-year yields rose to 3.8% from 1.5% at the start of the year.
- The U.S. dollar started off the year on a tear, rising to its highest levels in two decades by the third quarter. The dollar weakened during the fourth quarter as inflation showed clearer signs of having peaked.
- Oil prices went on a round-trip in 2022, rocketing to a high of $106 per barrel in March as Russia’s invasion of Ukraine limited oil supplies. Prices moderated after the summer and oil finished the year around $80.
- Cryptocurrency had a painful year for the record books as the largest cryptocurrency bitcoin lost over $550 billion in market cap as it declined 64.7%.
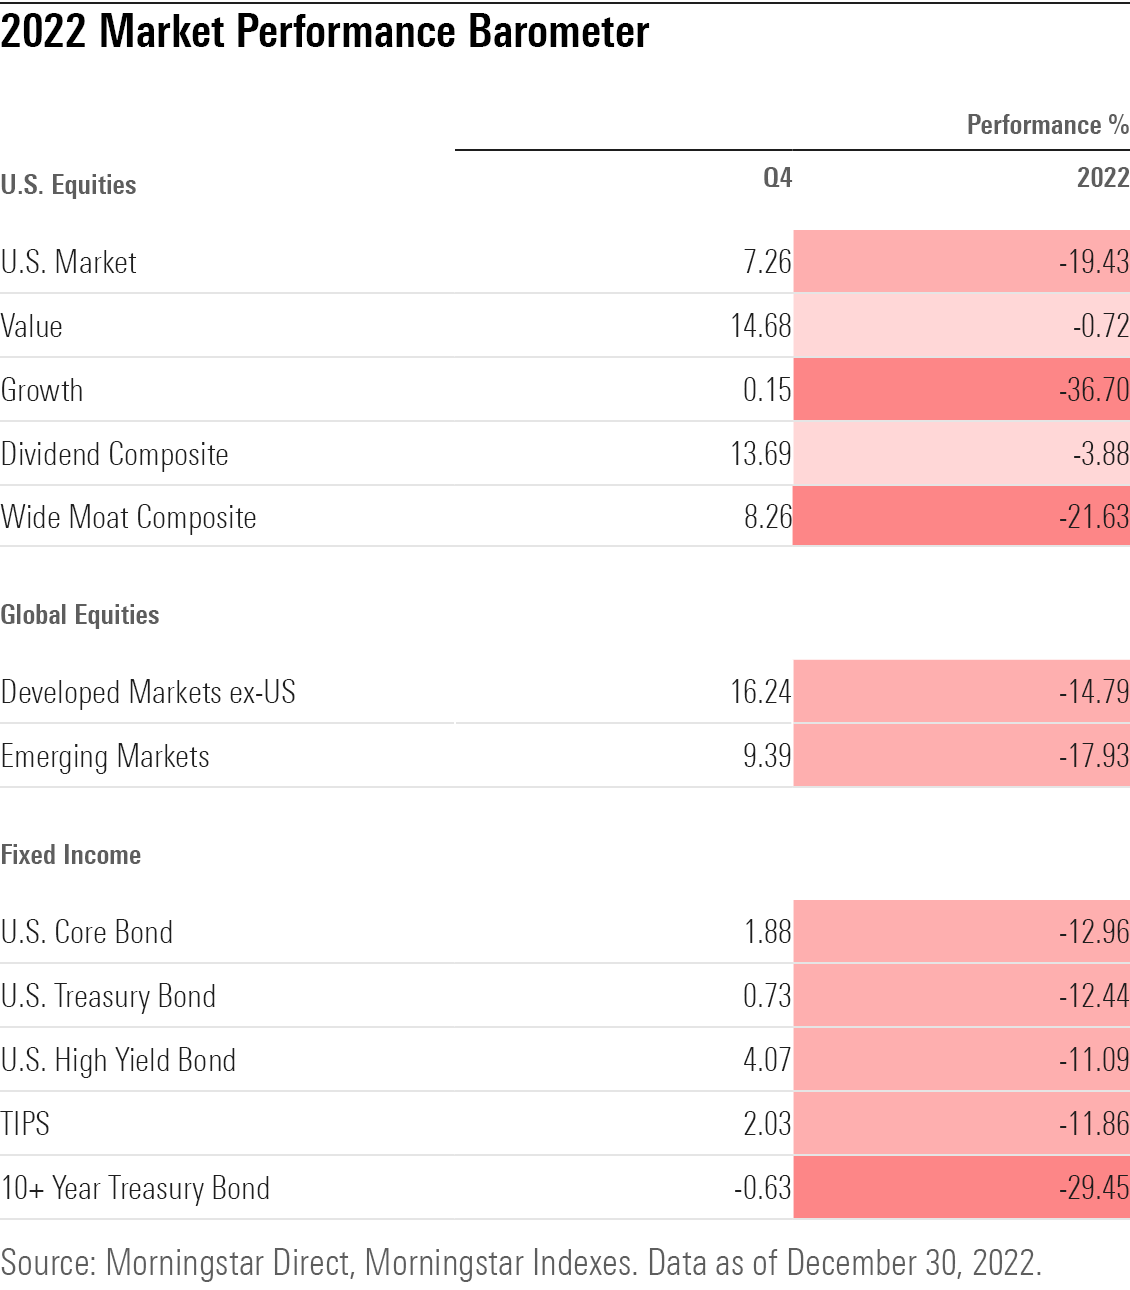
Stock Market Performance
For stock investors, the year started on a high note but went downhill from there.
The Morningstar US Market Index hit a record high on Jan. 3 and finished the year mired in a bear market.
While big picture, macroeconomic forces often play a key role in stock market performance, 2022 was a year where they were by far and away the dominant factor in returns. The key variable: Stubbornly high inflation that led to the unprecedented series of interest-rate increases by the Fed. Fueled by a red-hot economy, supply chain snarls spilling over from the pandemic, and a surge in oil and other commodity prices brought on by Russia’s attack on Ukraine, inflation stayed higher, longer than most investors—and the Fed—had initially expected.
To a certain extent, it could have been worse. All the way through the third quarter corporate earnings stayed relatively healthy across much of the market, providing some support for stock prices. A key variable that investors are watching in 2023 is the degree to which earnings are able to remain buoyant, or if expectations are too high, which could spell more trouble for the market.
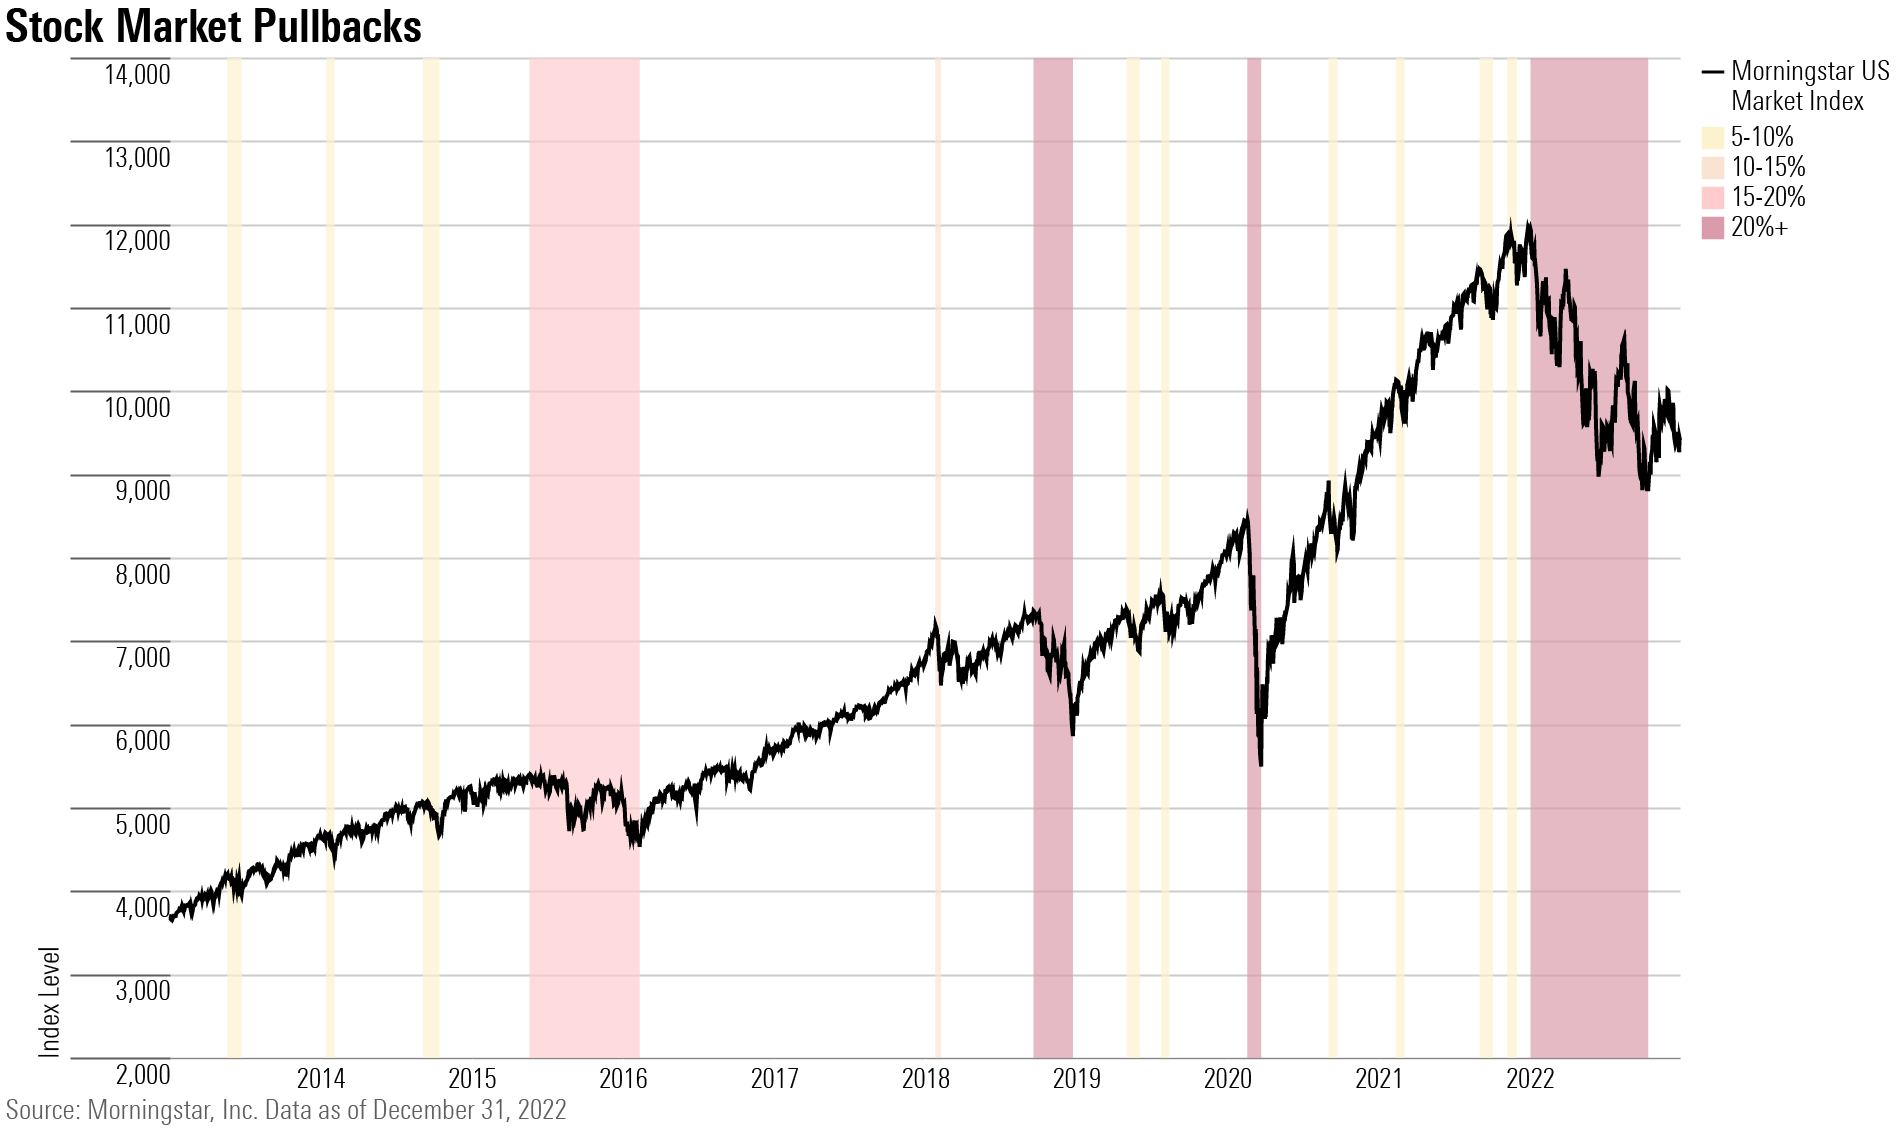
Bear markets typically have significant bounces and 2022 was no exception. Stocks staged their first major bounce in mid-June as investors began hoping that inflation was finally cooling and the Fed could end its rate increases. From June 16 through Aug. 16, the U.S. Market Index bounced 18.1%. But as inflation news disappointed investors, stocks sank back to new lows on Oct. 14, when the index was down 25.4% from its peak.
Another burst of optimism that the Fed would be able to pause its rate hikes and ``pivot” to lowering rates helped stocks bounce again from that October low, with the market gaining back just shy of 14% by the end of November. However, growing fears that 2023 will bring a recession as the Fed holds interest rates at high levels left stocks sinking into the final days of 2022.
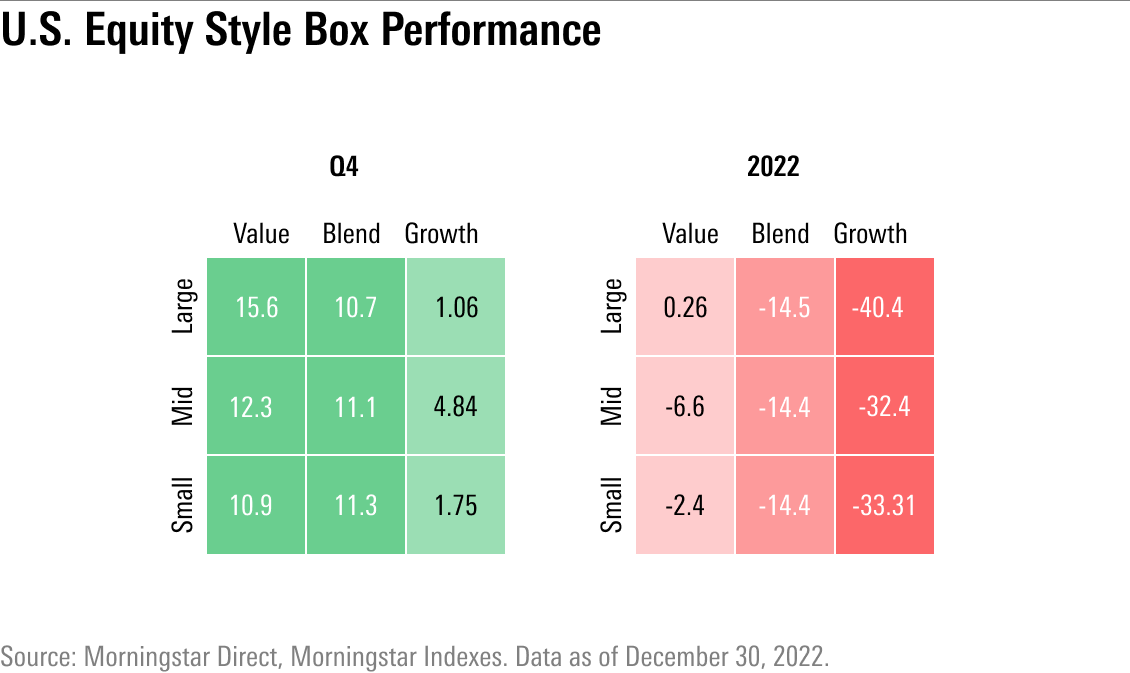
Value Stock vs. Growth Stock Performance
It was a terrible 12 months for growth stocks, which had their worst calendar year in over a decade. Amid the carnage, value stocks showed clear signs of a leadership comeback.
The Morningstar US Growth Index lost 36.7% in 2022 for its worst performance since the financial crisis in 2008. The Morningstar US Value Index ended the year down less than 1%.
Prior to last year, the growth index had consistently outperformed the value index since 2008. In 2020 and 2021, high-flying tech giants drove big gains for growth stocks, leading to some of the widest performance gaps over value stocks on record. But these sky-high tech valuations took a blow from quickly rising interest rates, leading to the growth stock implosion.
While tech stocks collapsed, value stocks remained relatively buoyant during the bear market, with some value names managing to carve out gains. Value stocks, as a group, are now ahead of growth stocks on a trailing one-, three-, and five-year basis.
2022 Stock Sector Performance
Energy stocks were the year’s clear winners as rising oil and natural gas prices—sparked by OPEC production cuts and ripples from Russia’s attack on Ukraine—contributed to big gains for the sector. Led by energy giants Exxon Mobil (XOM) and Chevron (CVX), the Morningstar US Energy Index outperformed all other stock sectors by a wide margin.
One of the worst places for investors to have their money in 2022 was the technology sector, as Big Tech stocks collapsed, thanks to rising rates and recession fears. The six largest U.S. tech stocks—Apple (AAPL), Microsoft (MSFT), Alphabet, Nvidia (NVDA), Amazon.com (AMZN), and Meta Platforms—collectively lost nearly $4 trillion in market value in 2022 (they were worth about $10.7 trillion at the end of 2021). Big Tech’s outsize weighting in U.S. market indexes helped drag stocks into the bear-market territory that they were in for most of the year.
Among the stocks imploding in 2022, Tesla (TSLA) in particular made headlines thanks to chief executive Elon Musk’s trouble-plagued acquisition of Twitter. As Musk sold off billions of dollars worth of Tesla shares, the stock lost roughly 65%, and in the process fell off the list of 10 largest U.S. stocks.
Real estate stocks also saw their fortunes wither this year, declining on sharply higher interest rates and fears of recession. This came after a particularly strong year in 2021, when real estate investment trusts had their best year in history and were second only to energy stocks in returns.
Stocks from Morningstar’s defensive Super Sector—encompassing consumer defensive, healthcare, utilities companies—broadly lived up to their name, protecting against some of the year’s steep declines.
Dividend-Stock Performance
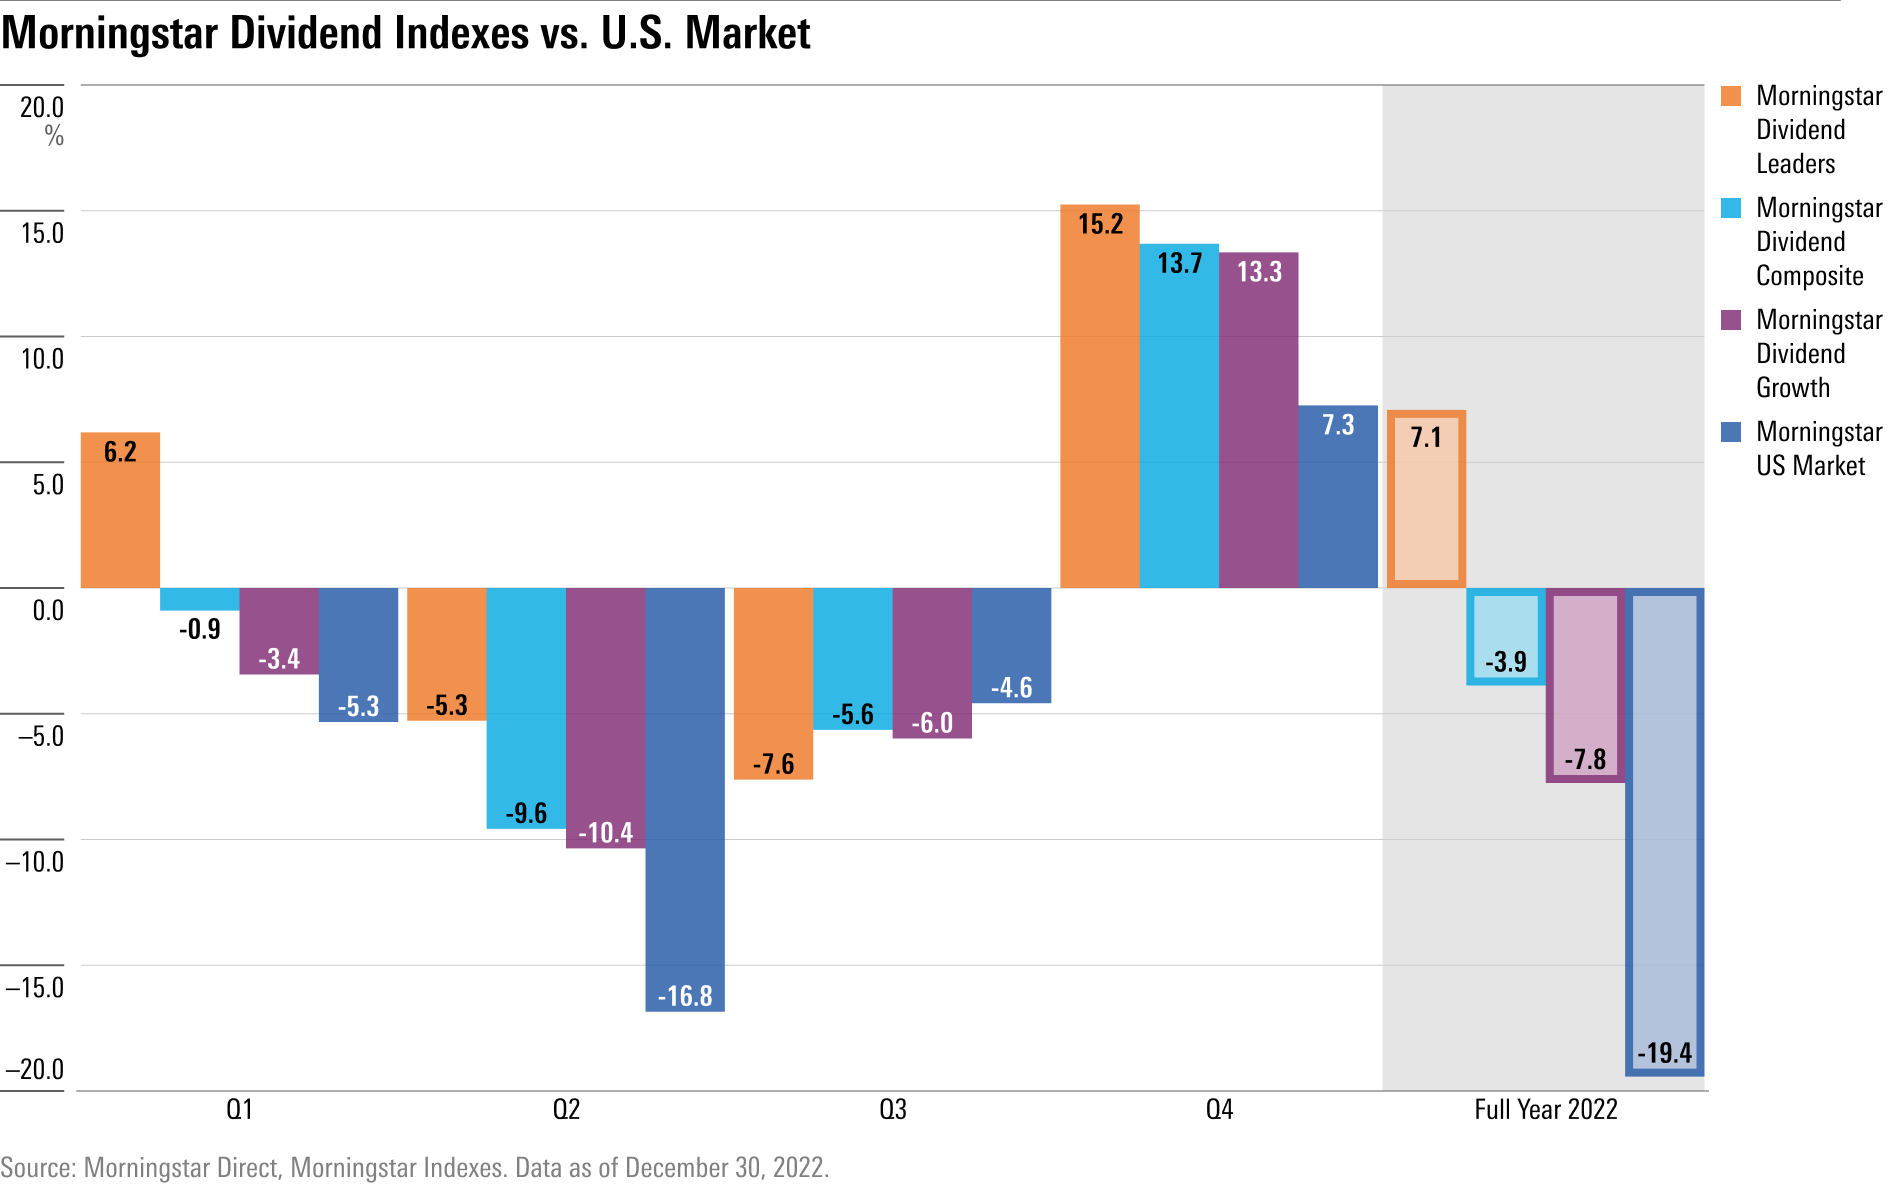
Stocks of companies that pay dividends to shareholders helped cushion the blows of the year’s bear market, and many of the highest-quality dividend payers even posted positive returns for the year.
The Morningstar Dividend Leaders Index—a collection of the 100 highest-yielding stocks that also maintain a consistent history of paying dividends with a designated ability to maintain those dividends going forward—finished the year with single-digit gains.
The high-quality dividend payers that drove gains in the Leaders Index came mostly from the energy and healthcare sectors. Winners included pharmaceutical companies AbbVie ABBV and Merck MRK, in addition to energy names Exxon Mobil and Chevron.
Wider baskets of dividend payers also protected against some of the stock market’s losses in 2022. The Morningstar Dividend Composite Index—a broad measure of dividend-stock performance—fell just 3.9%, coming in ahead of the market index by 15 percentage points.
The Morningstar Dividend Growth Index, which represents stocks of companies that have been growing their dividends over time, also performed better than the broad market but didn’t fare quite as well as some other dividend strategies, ending the year down 7.8%. A key reason for the weaker returns was the dividend growth index’s high technology sector weighting at the start of the year—17.7%, much higher than the dividend leaders’ allocation of 9.8%—which dragged down the index in a year when tech stocks suffered.
The Fed’s Aggressive Anti-Inflation Push
In an effort to stamp out decades-high inflation, the Fed raised the federal-funds rate target at its fastest pace in history, leading bond yields to jump to their highest levels in years.
During the year’s first half, the central bank raised the funds rate three times, ramping up the size of the moves each time, culminating in June’s aggressive 0.75-percentage-point hike. Before June, the Fed hadn’t raised its flagship policy rate by three fourths of a point in any single meeting since 1994.
The Fed continued its hawkish fight against inflation over the course of the year, engineering three additional 0.75-percentage-point increases during the second half of 2022. At the latest Federal Open Market Committee meeting in December, the Fed tacked on another, slightly less aggressive, rate hike of 0.50 percentage points.
The effective federal-funds rate target ended 2022 at 4.25%-4.50%, up from zero at the start of the year.
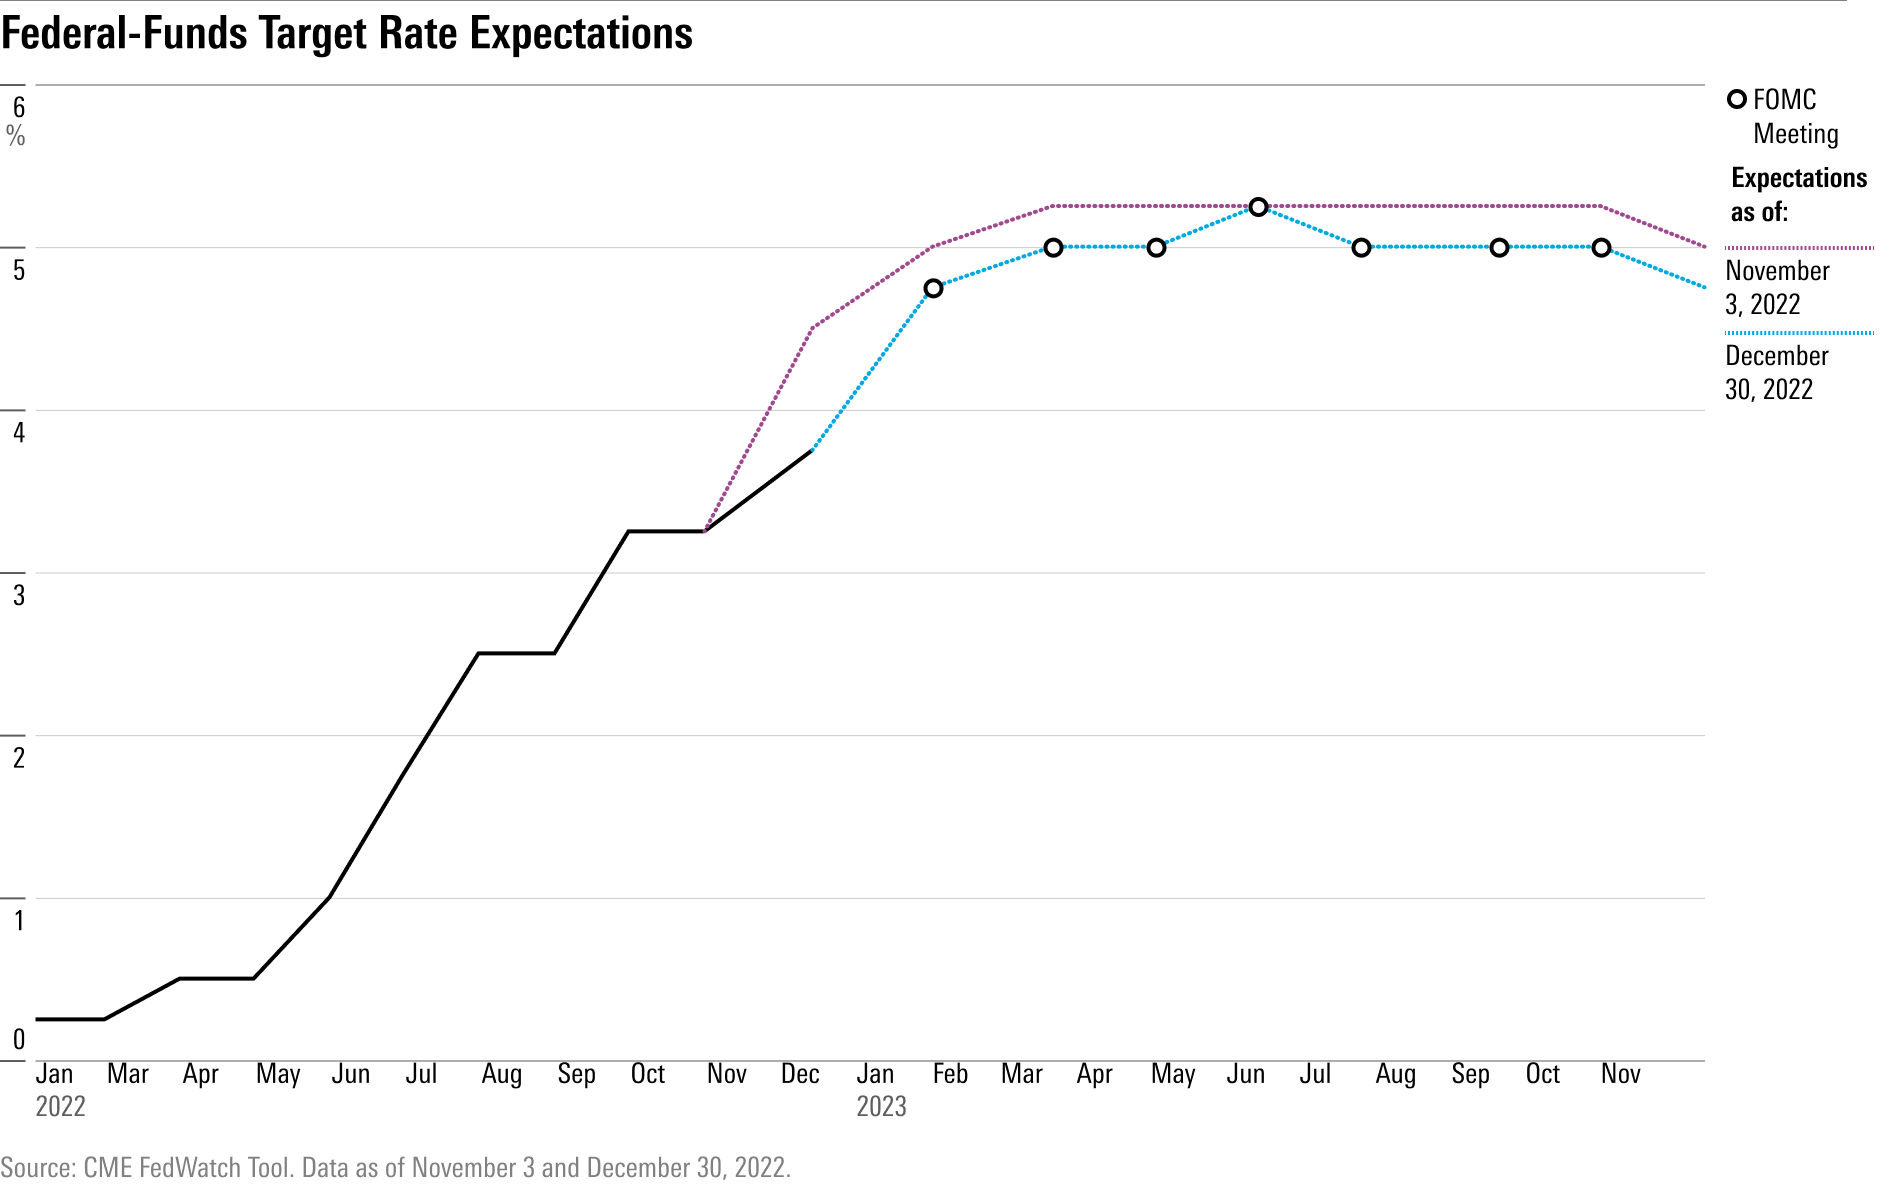
Even as Fed Chair Jerome Powell signaled a determination to keep rates high as long as inflation remains a problem, the markets—as well as Morningstar’s chief U.S. economist Preston Caldwell—are seeing signs that the Fed will be able to stop raising rates early in 2023, and even pivot to lowering rates by the end of the year.
When the Fed meets next in February, Caldwell expects the rate-hike pace to slow to 0.25 percentage points. The remaining question, he says, is where the Fed pauses its rate hikes and how long it will stay there.
The updated projections from the policymaking Federal Open Market Committee show a median expected federal-funds rate of 5.1% in December 2023, up from 4.6% in the prior projection from September. This implies three more rate hikes of 0.25% in 2023 with no cuts through the end of the year.
Futures markets, as measured by the CME FedWatchTool, ended the year implying expectations of a federal-funds rate upper limit of 5.0% in July 2023, lasting through November before starting to decrease thereafter.
Treasury Yield Curve Inversion
The Fed’s aggressive interest-rate increases drove yields higher across the bond market, but especially among short-term bonds.
The U.S. Treasury 10-year note climbed to a high of 4.25% for the year in October, its highest level since 2008. The long-term note finished the year at 3.8%, up from 1.5% at the end of 2021. Meanwhile, the yield on the U.S. Treasury two-year note finished above the 10-year at 4.3%: That’s over 6 times higher than its 0.7% level at the end of 2021.
When short-term Treasury yields exceed long-term yields, it’s known as an inverted yield curve in Wall Street jargon. An inverted yield curve is a sign of investor pessimism about the economy, and it’s also often seen as a precursor to recession (not all yield-curve inversions lead to recessions, but almost all recessions are preceded by an inversion of the yield curve).
Last year, the yield curve first inverted briefly on March 31, then again in July, and has remained inverted since. On Dec. 7, the gap between the yield on the two-year note and the 10-year note reached a high of 0.84 percentage points, its biggest inversion since 1981.
2022 Bond Market Performance
It was a horrendous year for the bond market.
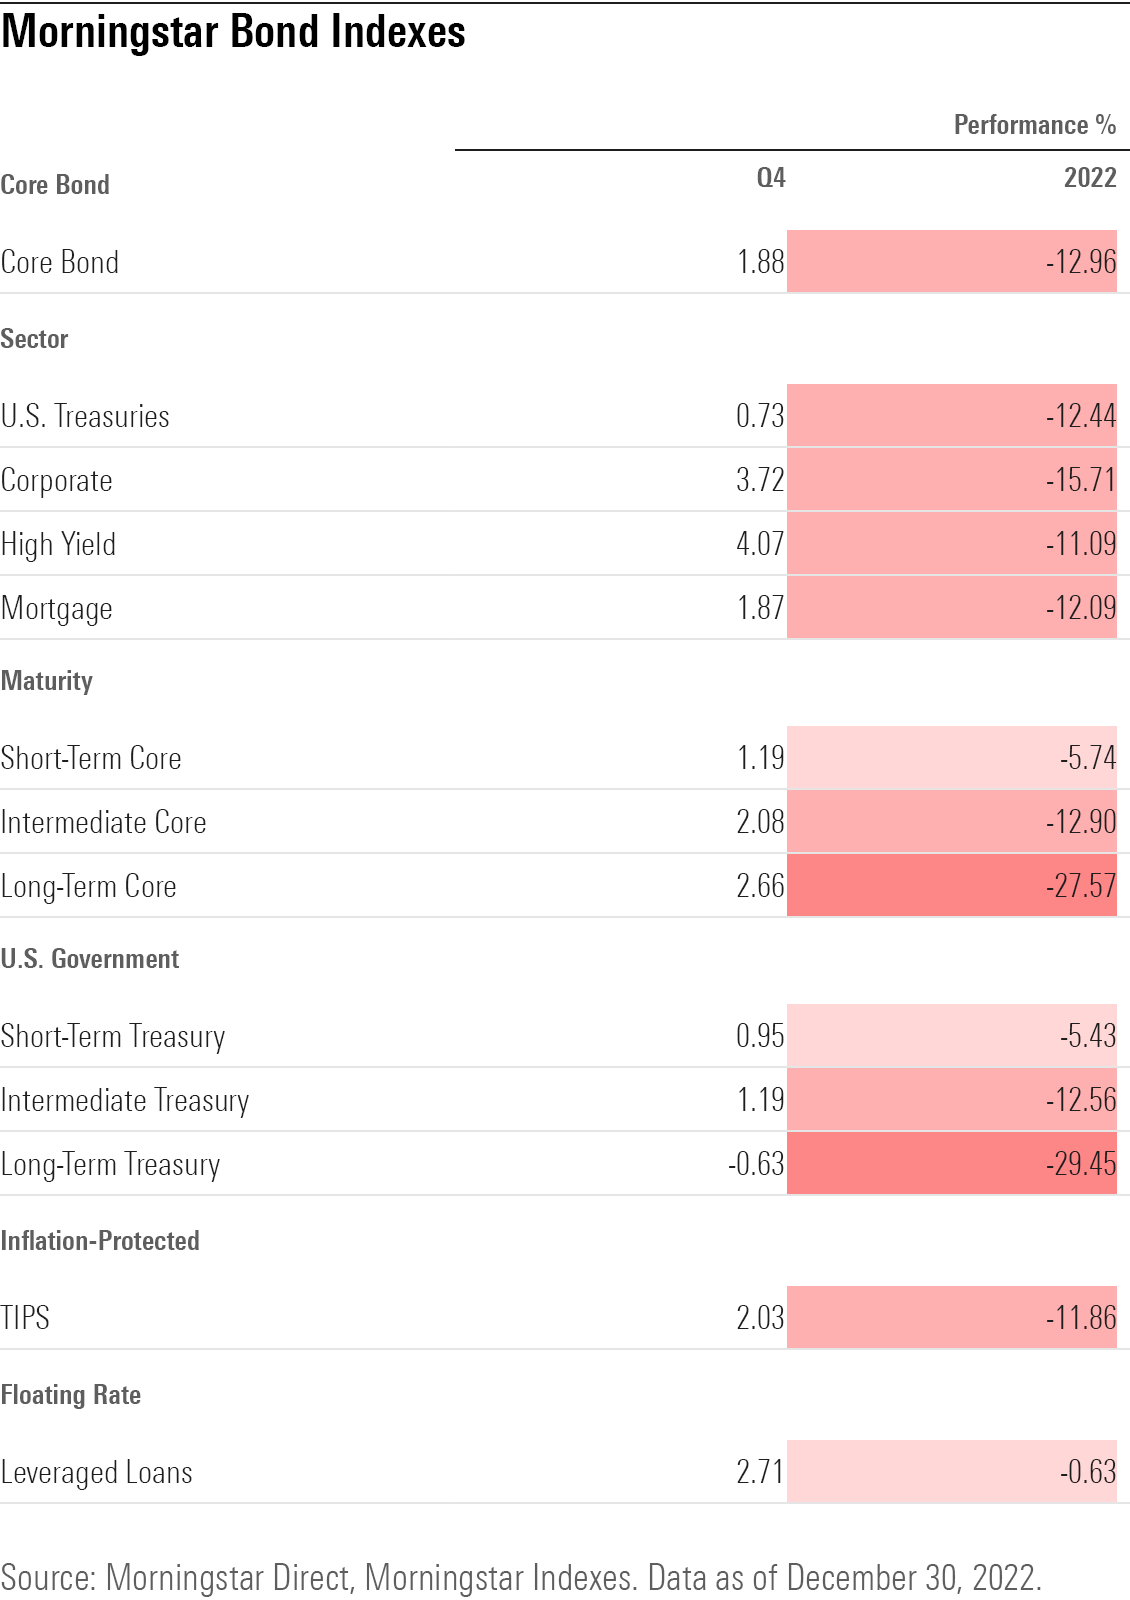
Steep losses were suffered in nearly all areas of fixed income, driven by surging inflation and the Fed’s unprecedented interest-rate increases. Several Morningstar bond indexes logged their worst years in history.
Bonds started off the year in a sea of red as investors anticipated the Fed’s first set of interest-rate hikes. As inflation stayed hotter than expected, the Fed continued aggressively raising rates throughout 2022, contributing to further losses for fixed income.
The fourth quarter offered some relief, with all areas of the bond market posting positive three-month returns, but it wasn’t enough to reverse the abysmal performance seen in the rest of the year.
The broad-based Morningstar US Core Bond Index took a hard fall in 2022, down 16.7% at its lowest point in the year and ending with the steepest annual decline in the index’s history, which dates back to 1999. Before 2022, the index had only experienced two calendar years in the red. Neither year’s loss exceeded 2%.
Long-term bonds—those due in 10 years or more, whose longer durations make them highly sensitive to interest rates—experienced the worst of the damage. The Morningstar Long-Term Core Bond Index and the Morningstar Long-Term Treasury Index each fell over 25% for the year, their steepest losses on record by wide margins.
Even Treasury Inflation-Protected Securities, or TIPS, which are designed to protect investors in times of high inflation, didn’t offer refuge, ending the year with double-digit losses.
Ultrashort bonds and floating-rate debt offered the only bright spots for bond investors. Ultrashort bonds were kept afloat by their very short maturities, which make them less sensitive to changes in interest rates. Leveraged loans have historically performed well in rising rate environments, and their floating-rate nature provides protection from inflation, writes Morningstar’s director of fixed income and multi-asset indexes Katie Binns.
A silver lining for investors is that the year’s big losses could paint a better picture for 2023. Bond yields and bond prices move in opposite directions, and last year’s declines have led to a huge rise in bond yields. For the first half of 2023, Morningstar’s chief markets strategist David Sekera expects intermediate bonds (those with three- to five-year maturities) to provide the greatest amount of yield for the lowest amount of duration risk.
Stock and Bond Market Volatility
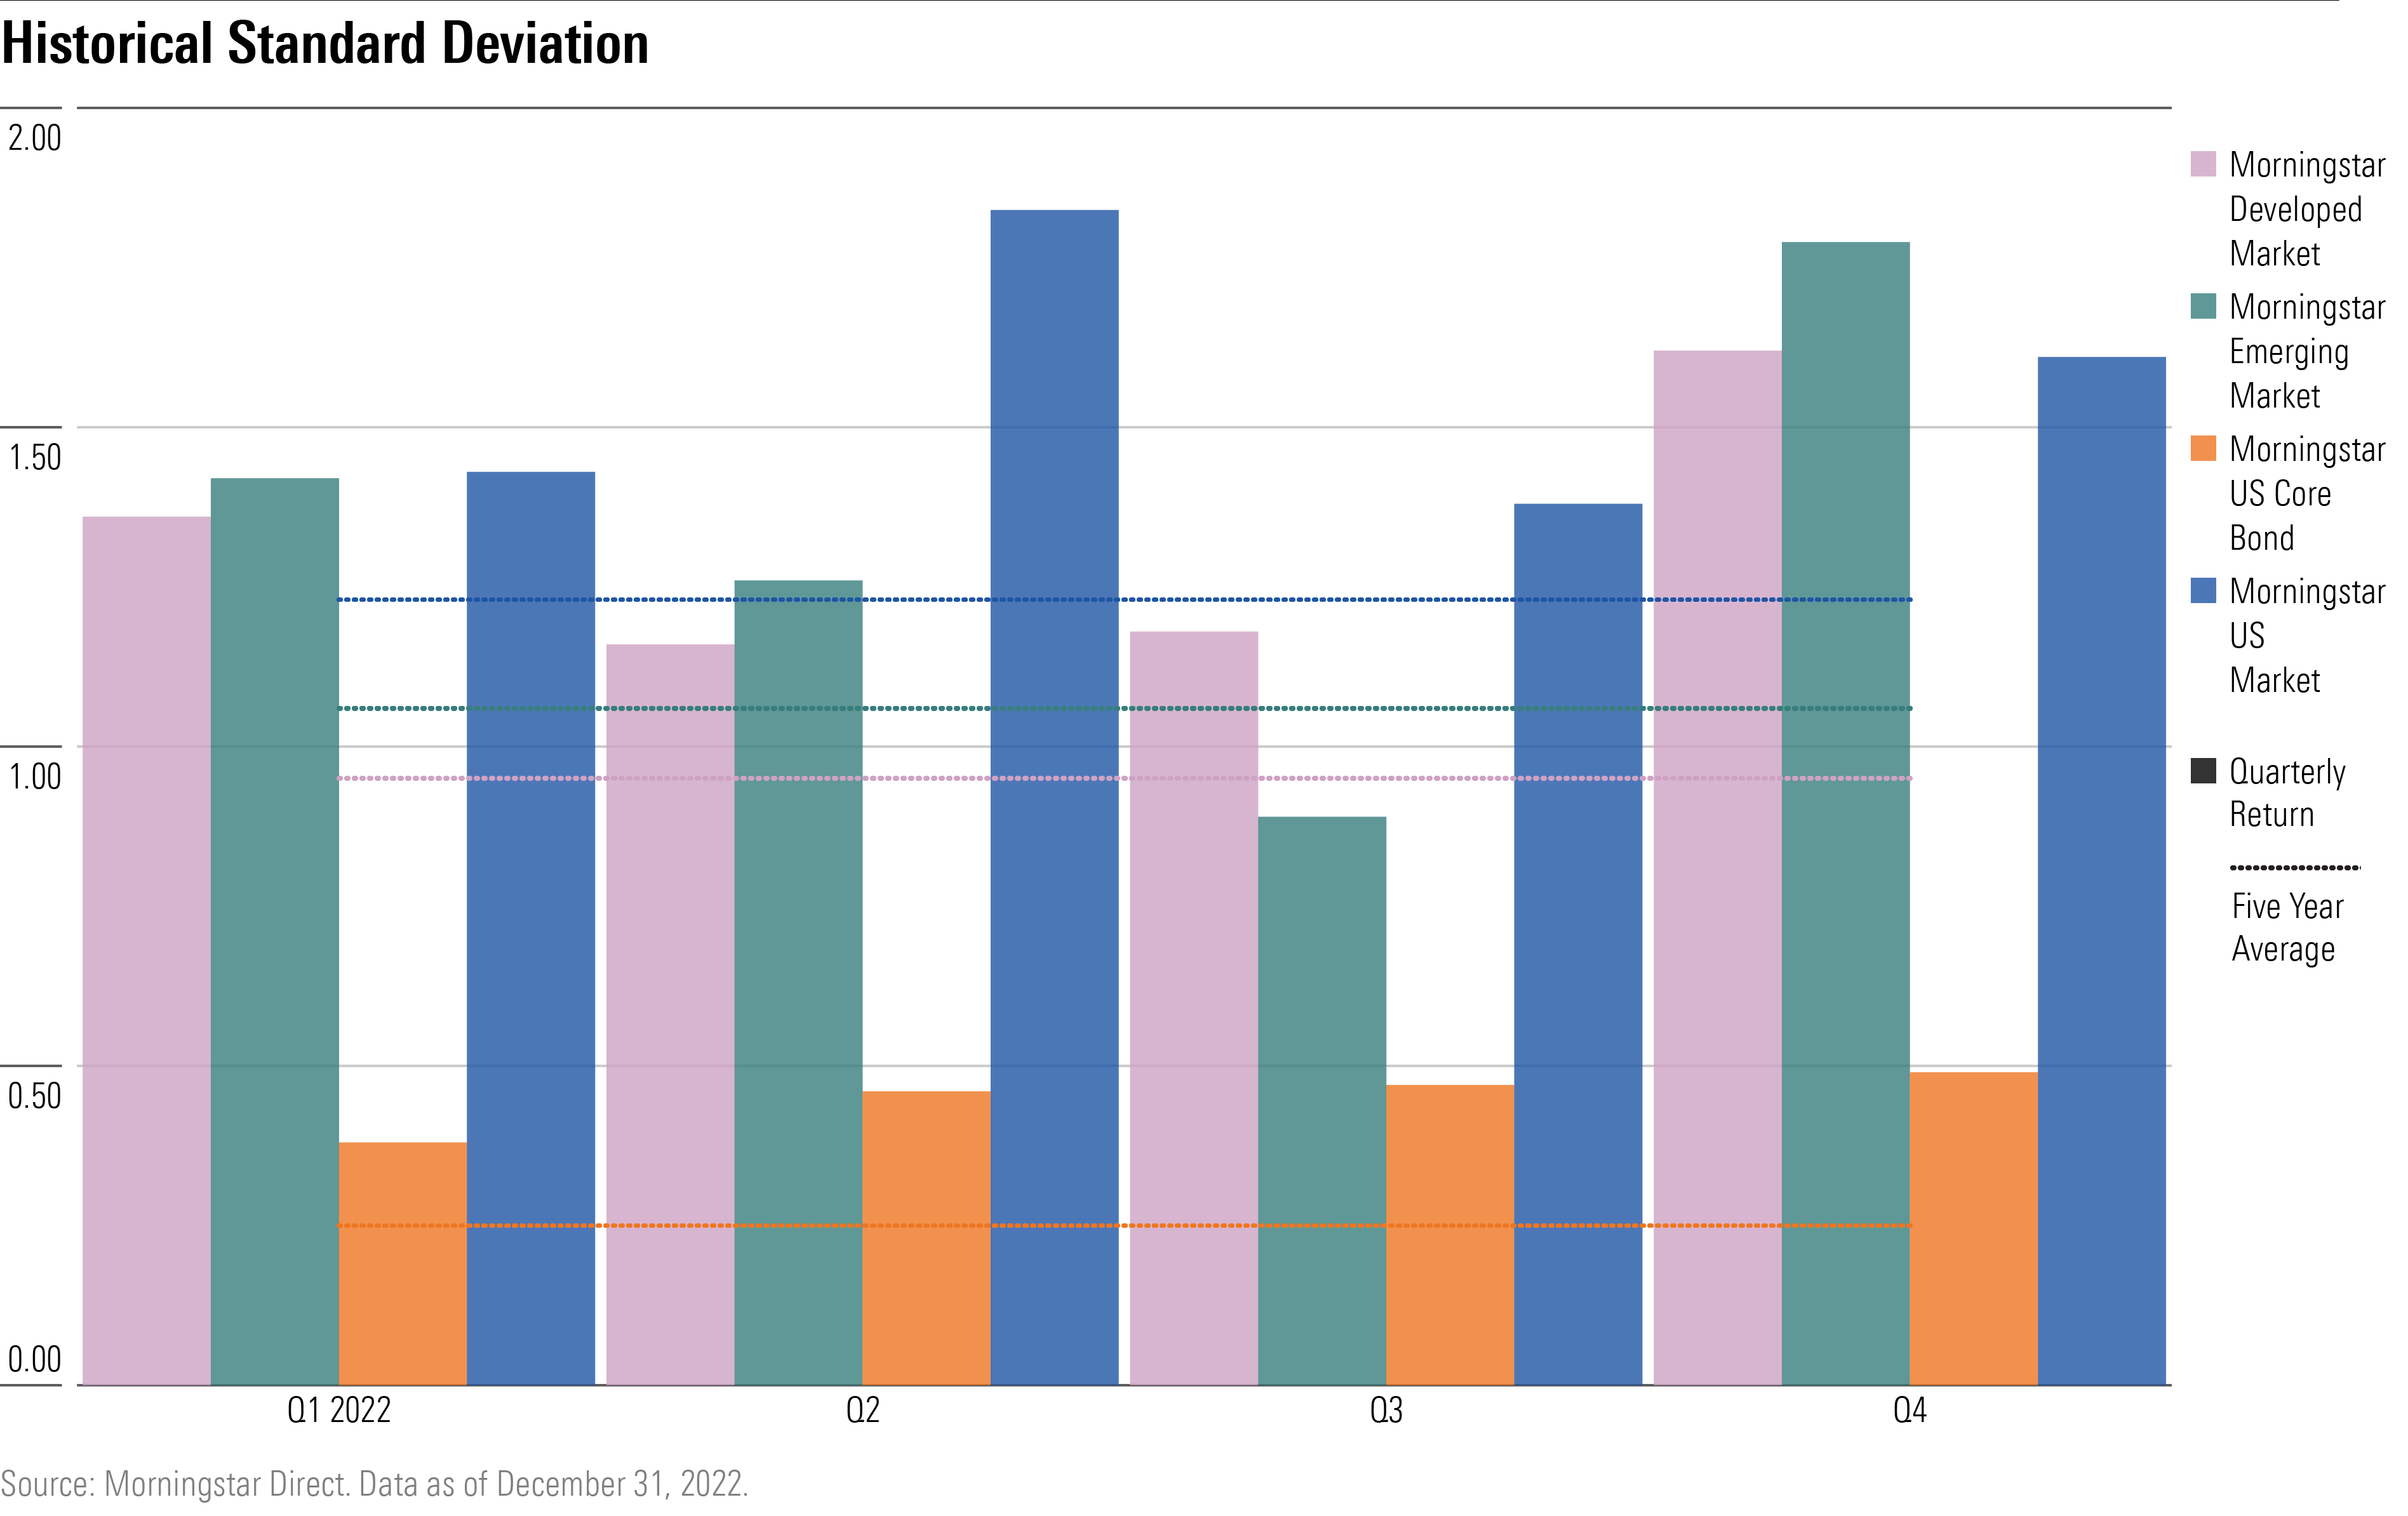
With an uncertain economic landscape, the Fed’s aggressive policy moves, and both stocks and bonds selling off as steeply as they did, high volatility was a near-constant feature of the markets in 2022.
That was especially true in the bond market, where volatility—measured by standard deviation—ran at twice its historical level in the last three quarters of the year, a notable occurrence for a market that most investors look to for stability.
Volatility in all corners of the market was charged by the market’s back-and-forth thinking about how much the Fed would have to raise interest rates.
In the third quarter, investors began to think that the Fed wouldn’t have to raise rates as much as many had feared. But then when inflation came in much hotter than expected in September, that caused a rethink, leading to a new downdraft in the markets and another spike in volatility.
2022′s Best and Worst Market Performers
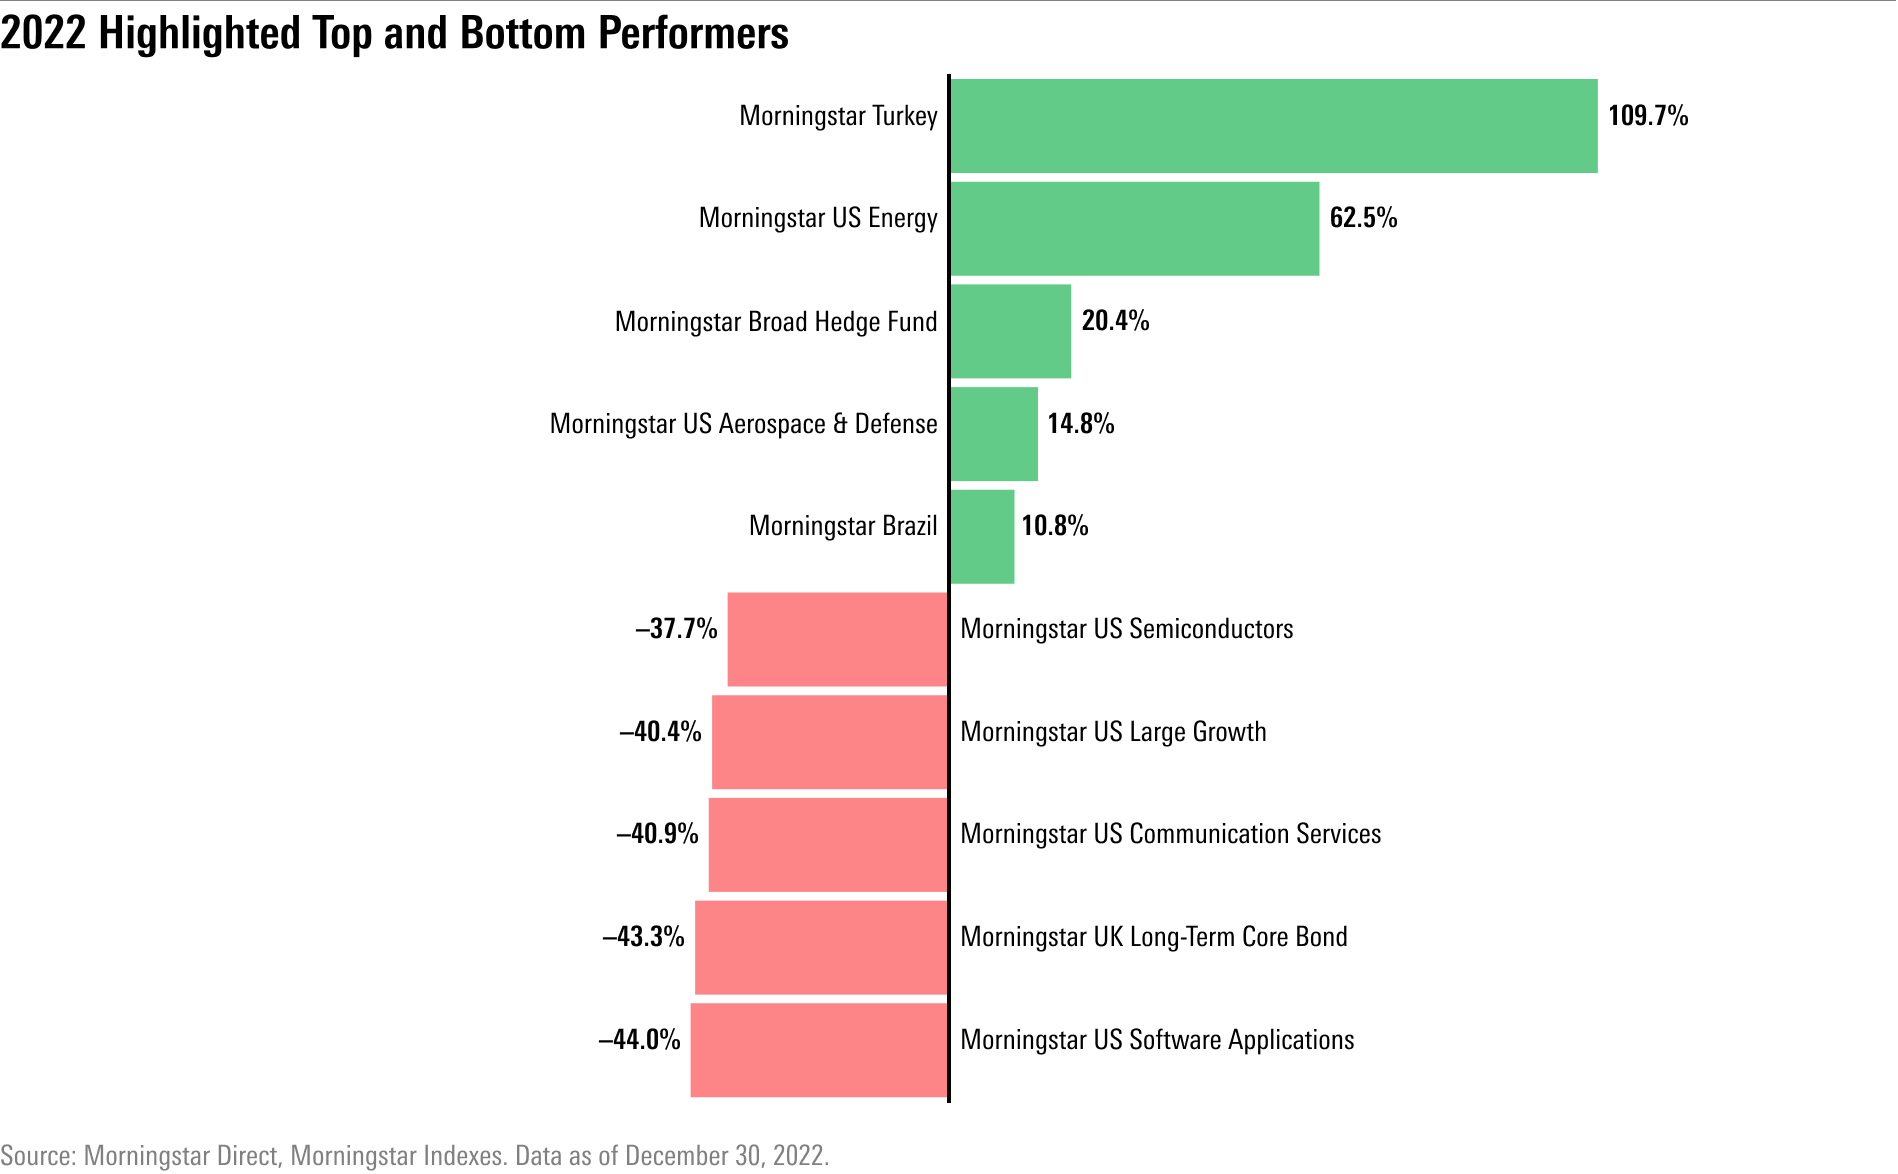
Among all Morningstar Indexes, the Morningstar Turkey Index was the top performer in 2022, gaining over 100%. The Turkish central bank slashed interest rates, even as inflation raged through the country.
The Morningstar US Energy Index was a high-flyer, outperforming all other U.S. sectors by wide margin as oil and gas prices rose. On the industry level, the Morningstar US Aerospace and Defense Industry Index saw notable gains in 2022, led by Raytheon Technologies (RTX) and Lockheed Martin (LMT).
Another standout was the Morningstar Broad Hedge Fund Index, meant to capture the performance and behavior of the most investable hedge funds. One potential source of gains for these strategies has been their ability to bet on market downturns by short-selling.
High-tech, high-growth indexes were some of the worst performers in the market last year. The Morningstar US Semiconductors and the Morningstar US Software Application indexes each suffered losses of about 40%.
A loss of over 40% for the Morningstar UK Long-Term Core Bond Index spoke to how bad the situation was for bonds last year, as central banks around the world raised interest rates to combat global inflation. Over the past 10 years, the index had never lost more than 7% in any annual period.
2022 Currency Market Performance
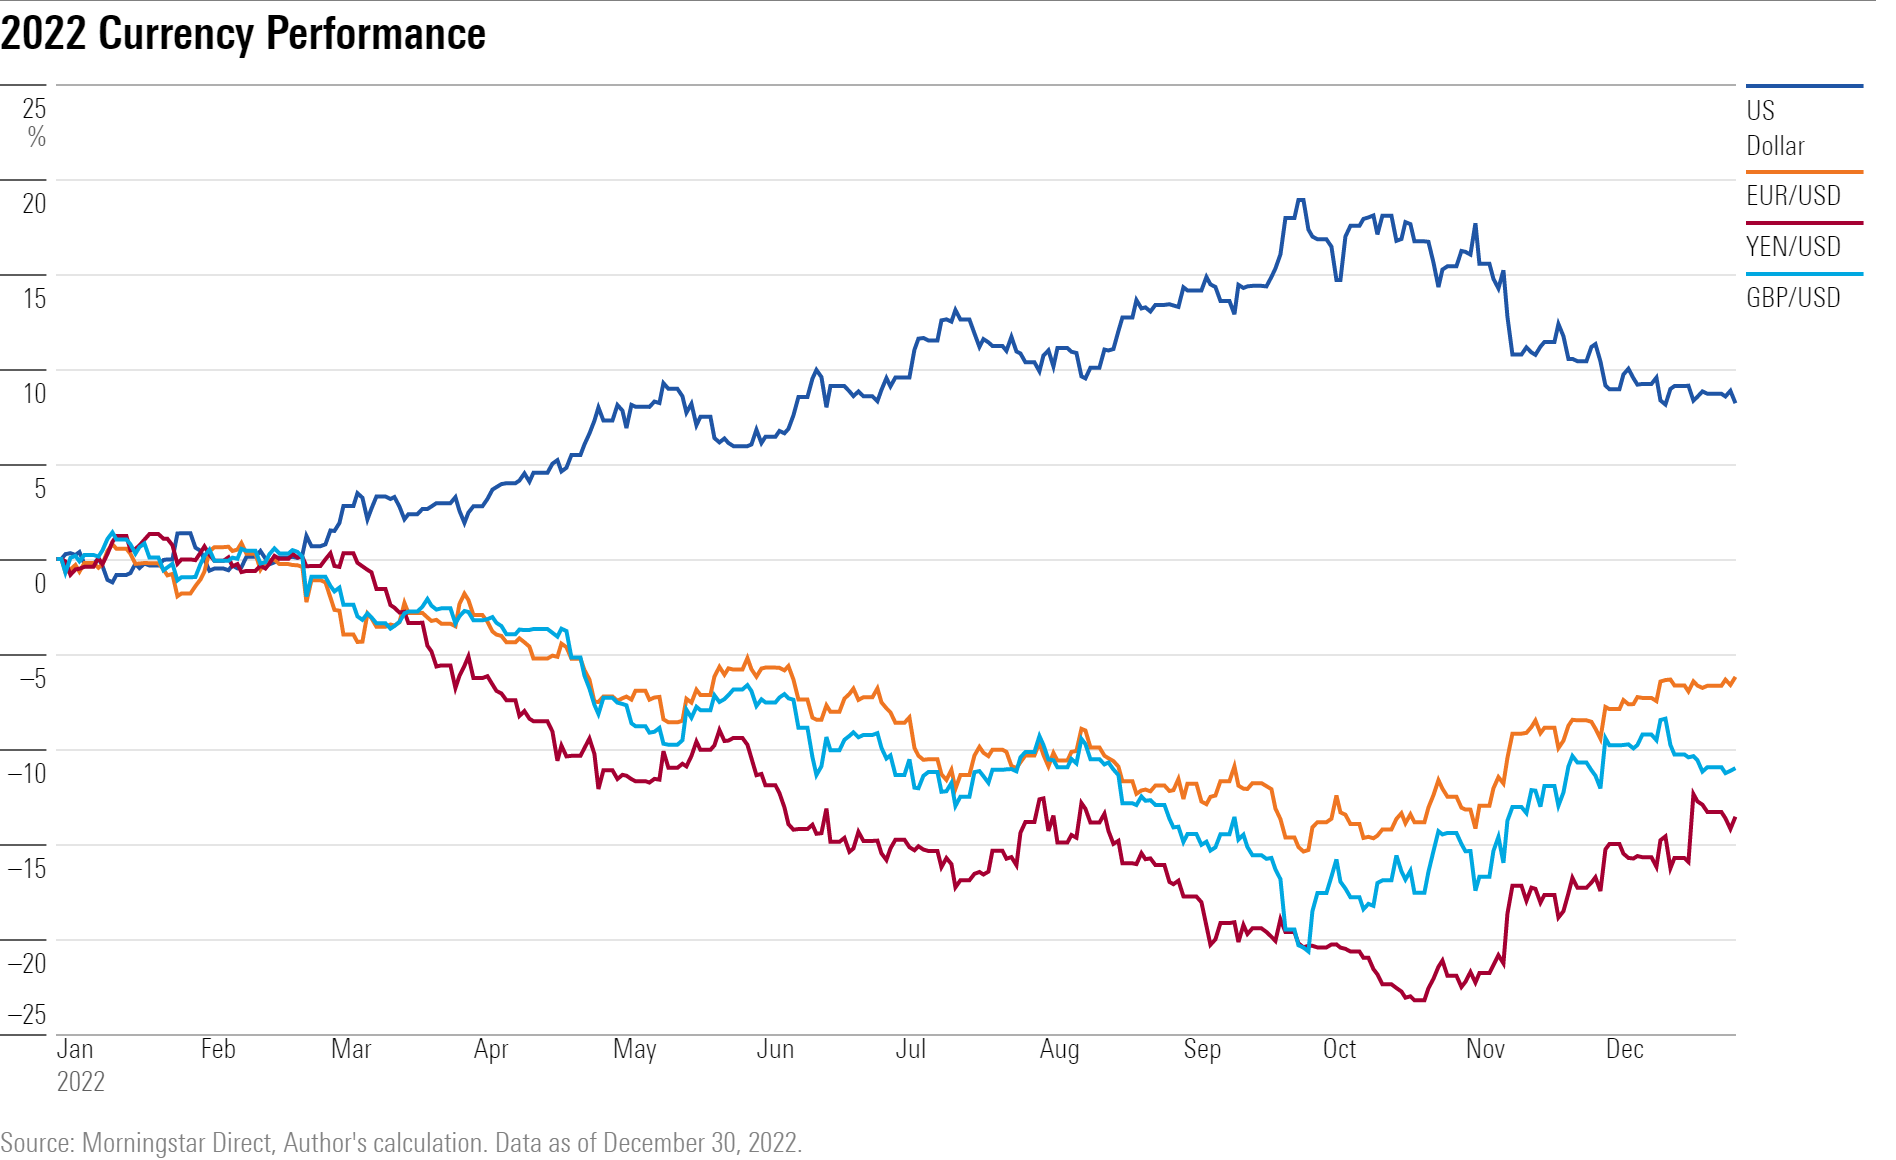
The U.S. dollar had a strong run for much of 2022 on the back of the Fed’s aggressive interest-rate increases. Its value rose to multidecade highs midway through the year.
During the fourth quarter, however, the dollar lost some of its earlier gains as inflation reports finally showed signs of a slowdown in prices. In November, the dollar had its biggest two-day drop since March 2009 and its worst monthly performance in over a decade.
The newly weakening dollar could cause a problem for the Fed and complicate the outlook for inflation, writes Morningstar columnist Sandy Ward. Even so, she adds, it’s too soon to tell if the dollar will continue on a downturn in 2023.
2022 Commodity Market Performance
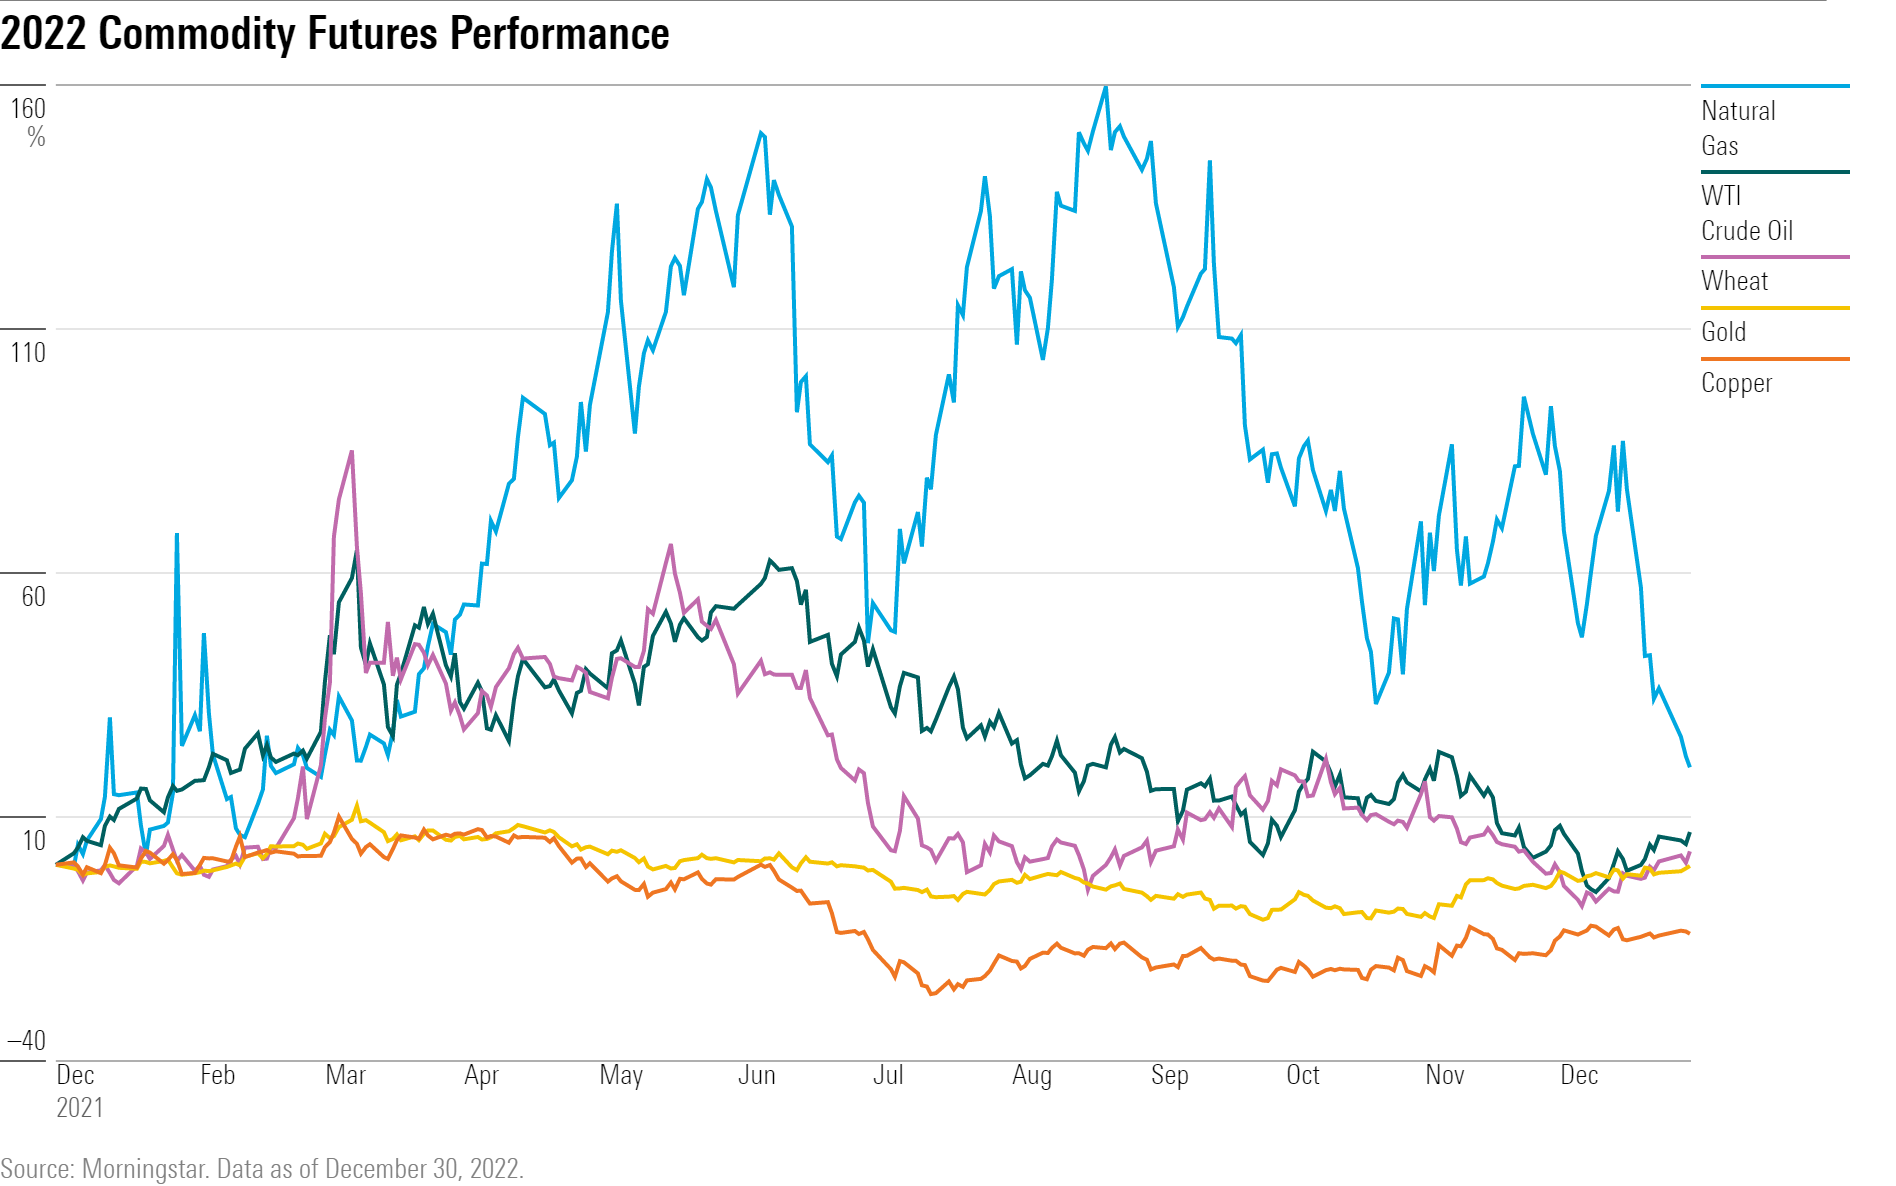
It wasn’t only stocks and bonds that had a wild year. Commodities, too, saw notable performance in 2022: Gold failed to act as an inflation hedge, oil and natural gas prices hit multiyear highs, and copper flashed recession warnings. Wheat prices surged early on in the year after Russia’s invasion of Ukraine tightened global supply of the crop.
While gold did provide a safe haven relative to painful stock market losses, it disappointed investors, who expected the metal to live up to its reputation as an inflation hedge. Gold struggled to compete with rising bond yields this year as the Fed hiked interest rates at their fastest pace in history. The strengthening U.S. dollar also made gold less accessible to foreign investors.
Natural gas prices reached their highest levels since 2008 and crude oil prices rose to levels not seen in a decade, reaching $106 per barrel in March. Russia’s invasion of Ukraine limited global supplies of both crude oil and wheat, which surged to an all-time high of $14.25 per bushel on March 7.
Copper—seen as a bellwether for the global economy, as it is used as an input in equipment and production for a wide range of industries—spent most of the year in negative territory after a second-quarter drop of 21%.
2022 Cryptocurrency Performance
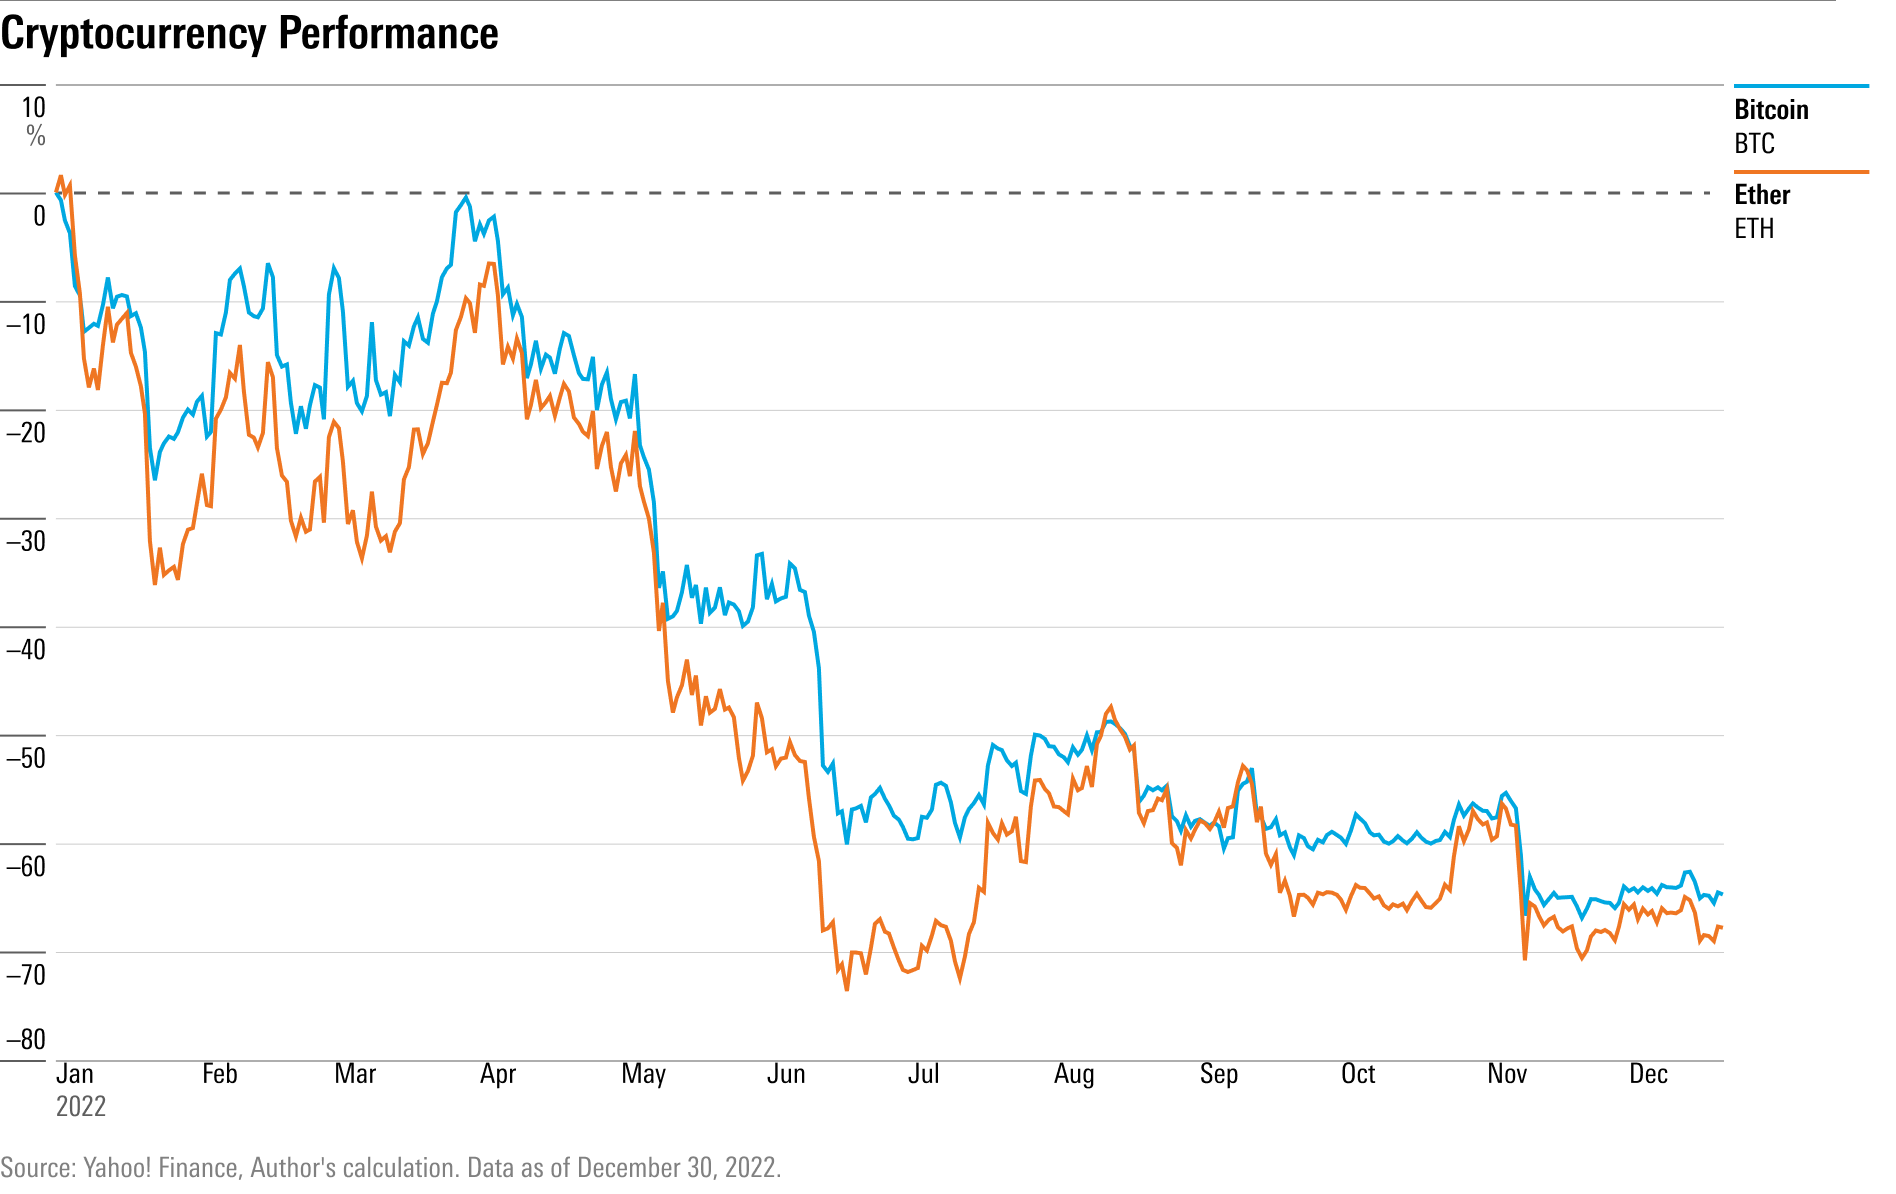
After rocketing to all-time highs in 2021, major cryptocurrencies bitcoin (the first cryptocurrency and the largest by market size) and ether plummeted in 2022, each losing over half the value they had at the start of the year as a series of crises at major trading platforms shook investor confidence.
The fourth quarter extended crypto losses from earlier in the year. On Nov. 6, investor fears over the collapse of major cryptocurrency exchange FTX led to single-day drops of 24% in the price of bitcoin and 30% in the price of ether.
This came after a series of other cryptocurrency debacles, including the crash of popular stablecoin Terra, which lost nearly all of its value in a few short weeks. Terra’s losses spooked investors throughout the cryptocurrency markets, as stablecoins are pegged to traditional currencies or commodities to help them maintain stable prices.
Morningstar analysts recommend that investors treat cryptocurrency assets as sunk costs.
Correction: Jan. 5, 2023: A previous version of 15 Charts Explaining an Extreme Year for Investors was corrected to revise the columns in the Morningstar Bond Indexes table.
The author or authors own shares in one or more securities mentioned in this article. Find out about Morningstar’s editorial policies.

/s3.amazonaws.com/arc-authors/morningstar/ba63f047-a5cf-49a2-aa38-61ba5ba0cc9e.jpg)
/cloudfront-us-east-1.images.arcpublishing.com/morningstar/F2S5UYTO5JG4FOO3S7LPAAIGO4.jpg)
/cloudfront-us-east-1.images.arcpublishing.com/morningstar/7TFN7NDQ5ZHI3PCISRCSC75K5U.png)
/cloudfront-us-east-1.images.arcpublishing.com/morningstar/QFQHXAHS7NCLFPIIBXZZZWXMXA.jpg)
:quality(80)/s3.amazonaws.com/arc-authors/morningstar/ba63f047-a5cf-49a2-aa38-61ba5ba0cc9e.jpg)